Intapp was using the word "card" for two different things. Until that was fixed, no amount of redesign would have made the pattern consistent.
Role
Associate UX Designer, paired with a Senior Designer
Timeline
April – August 2024
Client
Intapp
Team
Diad with a Senior Designer; collaborated with the Design Systems team
Surfaces
DealCloud · Microsoft channels
Stack
Figma · FigJam · Pendo · Asana
Constraints
One pattern had to work across Intapp and Microsoft surfaces
Design- and technology-agnostic by requirement
Three separate user bases — Private Equity, Legal, Real Estate
Guideline changes needed Design Systems team approval
Handed off before visual design was finalised
The problem
Client feedback kept pointing at the same need: insights had to be shareable across Intapp and
Microsoft product channels. Prior research had already concluded that a card redesign on the
new v4 components was necessary, and specific use cases required cards to be broadcast to
multiple channels as an Adaptive Card.
The design requirement was one sentence: a design- and technology-agnostic solution to unify
the card pattern across multiple channels.
That is the kind of ask that can absorb months and produce nothing. So how do you tackle a
large, ambiguous ask? That question — written on the board, in those words — was the real
first deliverable.
And underneath it, found during the audit, was a problem nobody had named yet:
Right now we’re using the term “cards” for two different things: as containers and as actual
UI elements. This is causing confusion and making it hard for us to talk about how we want
our product to evolve.
Product managers, designers, and researchers were each using “card” to mean something
different, then designing against their own definition. No component redesign would have fixed
that. The next team would have reintroduced the ambiguity within a quarter.
What we inherited
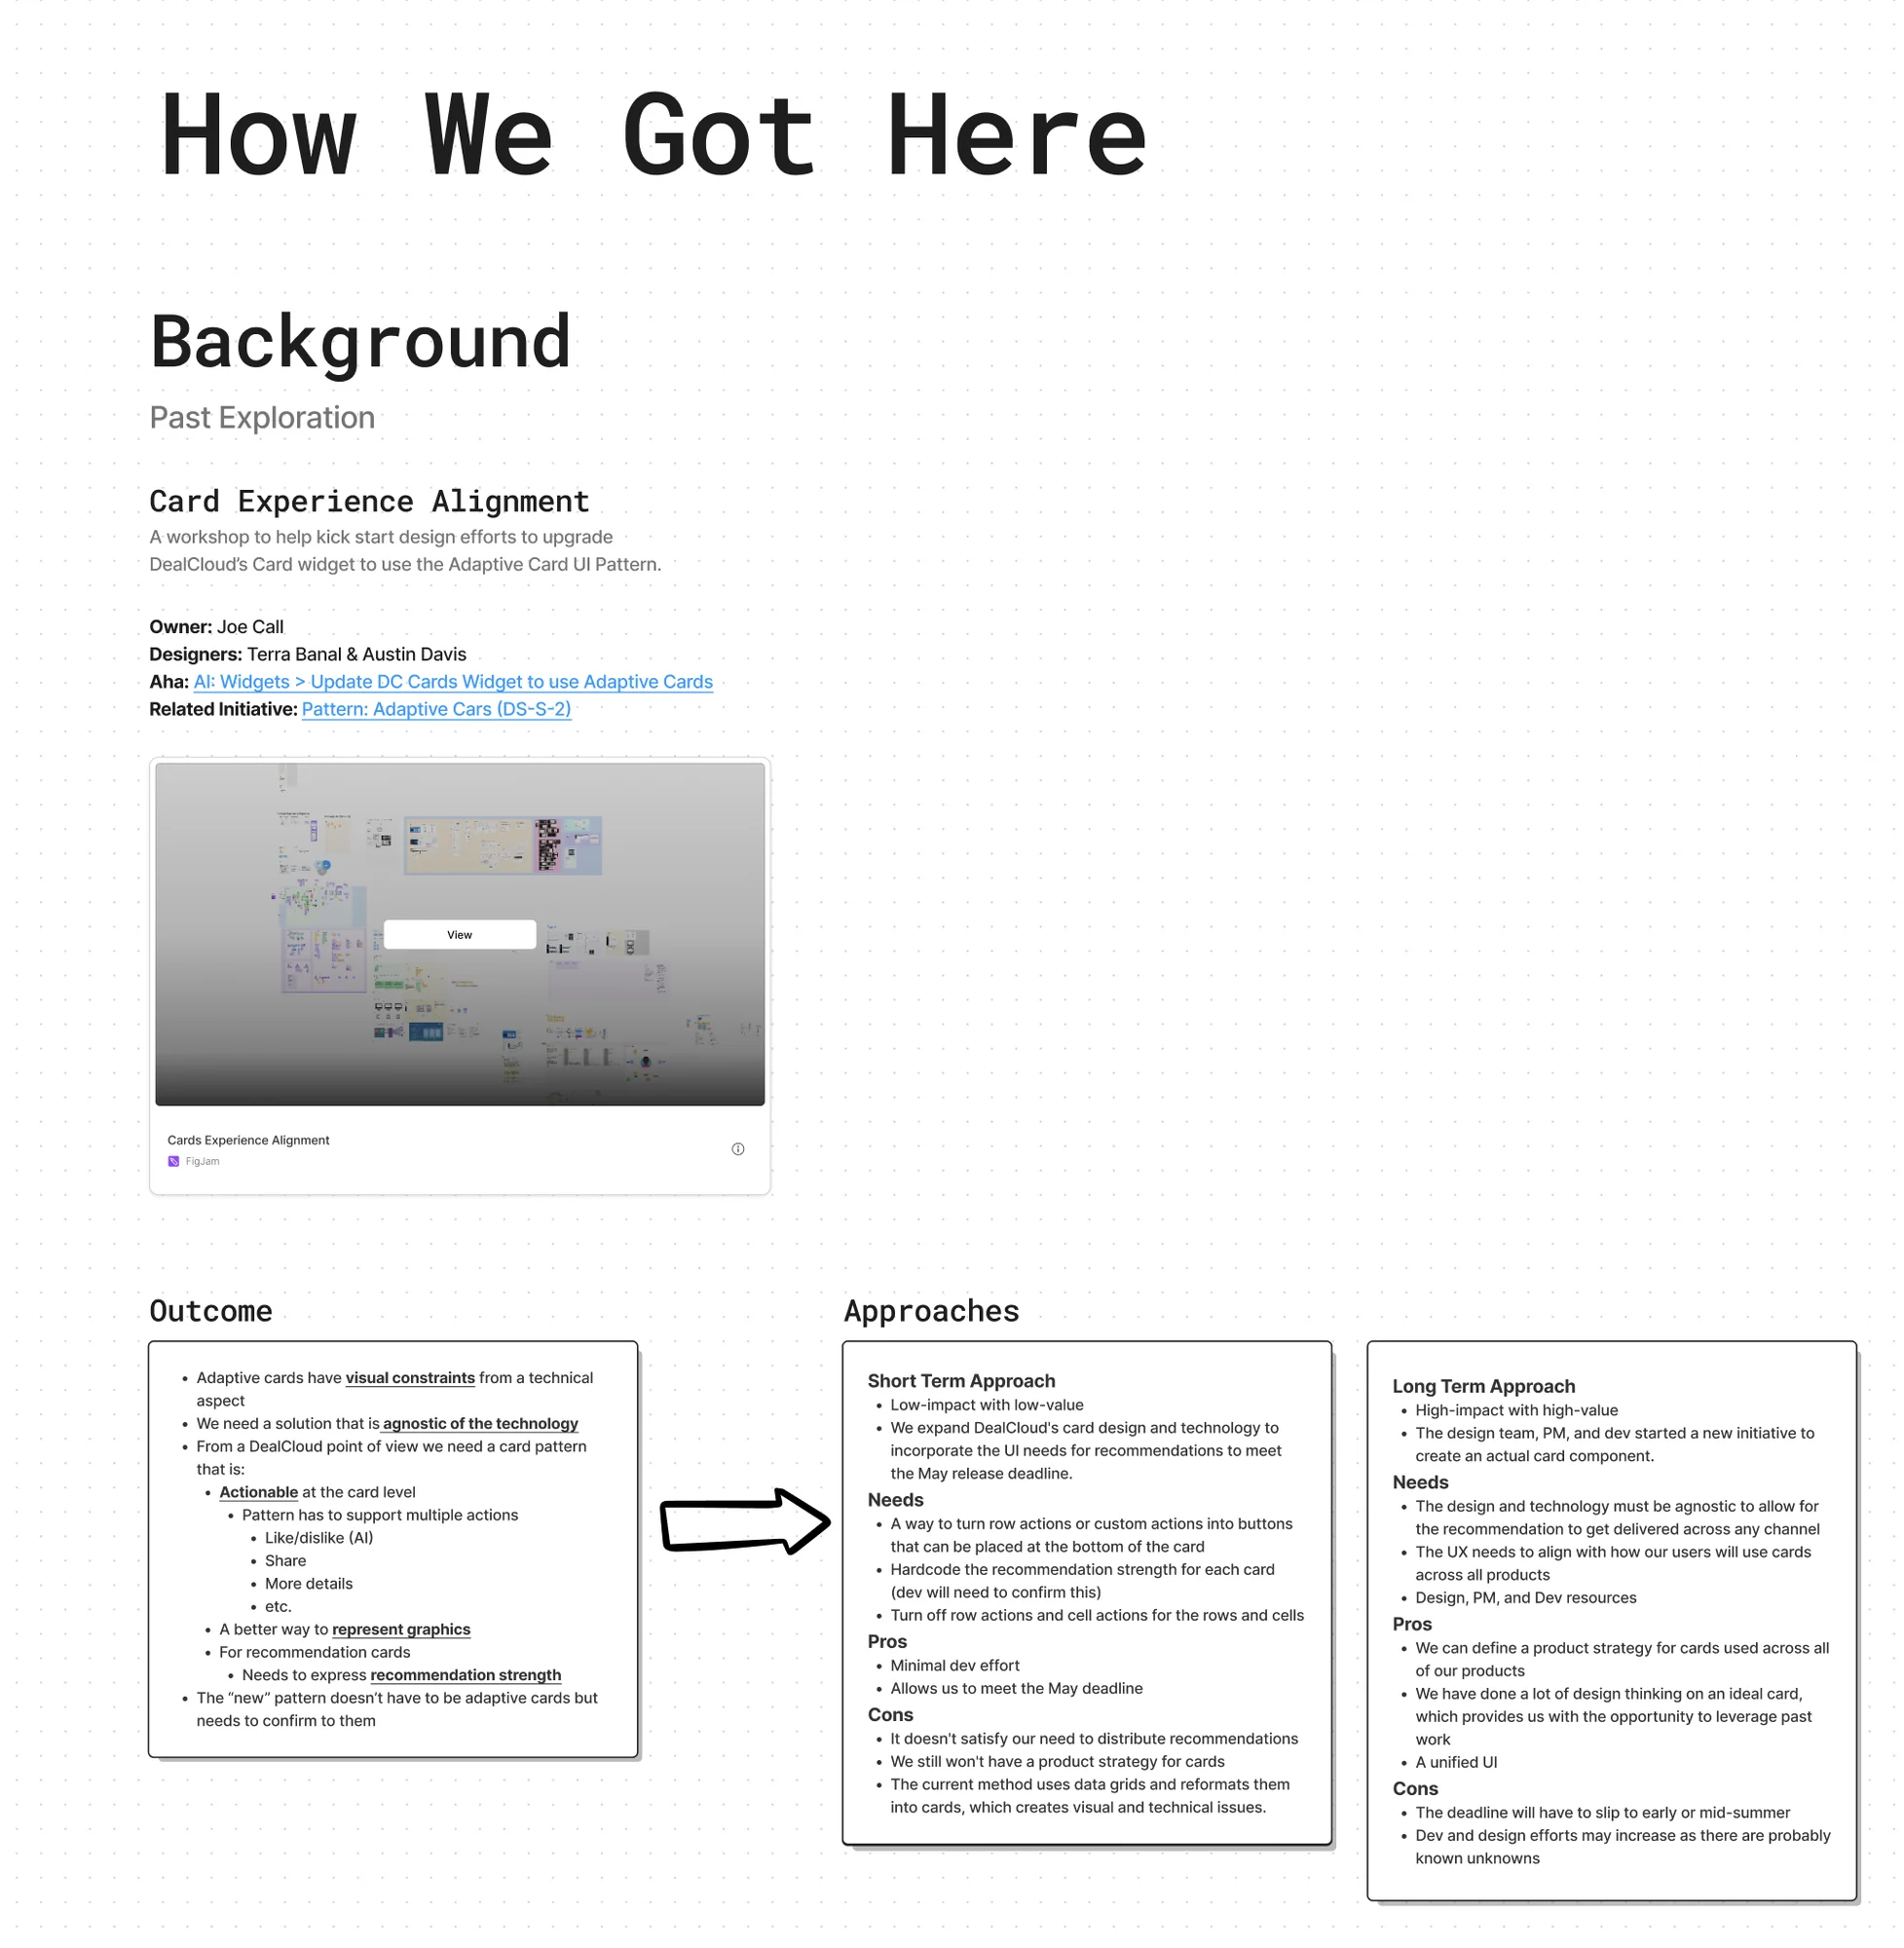
Full size ↗How we got hereA previous designer had done substantial work on mobile cards and started the framework we were asked to test for feasibility. Starting a project by writing down what already exists — who owned it, what it concluded, which approaches were already on the table — is how you avoid spending week one rediscovering week zero.
Framing before designing
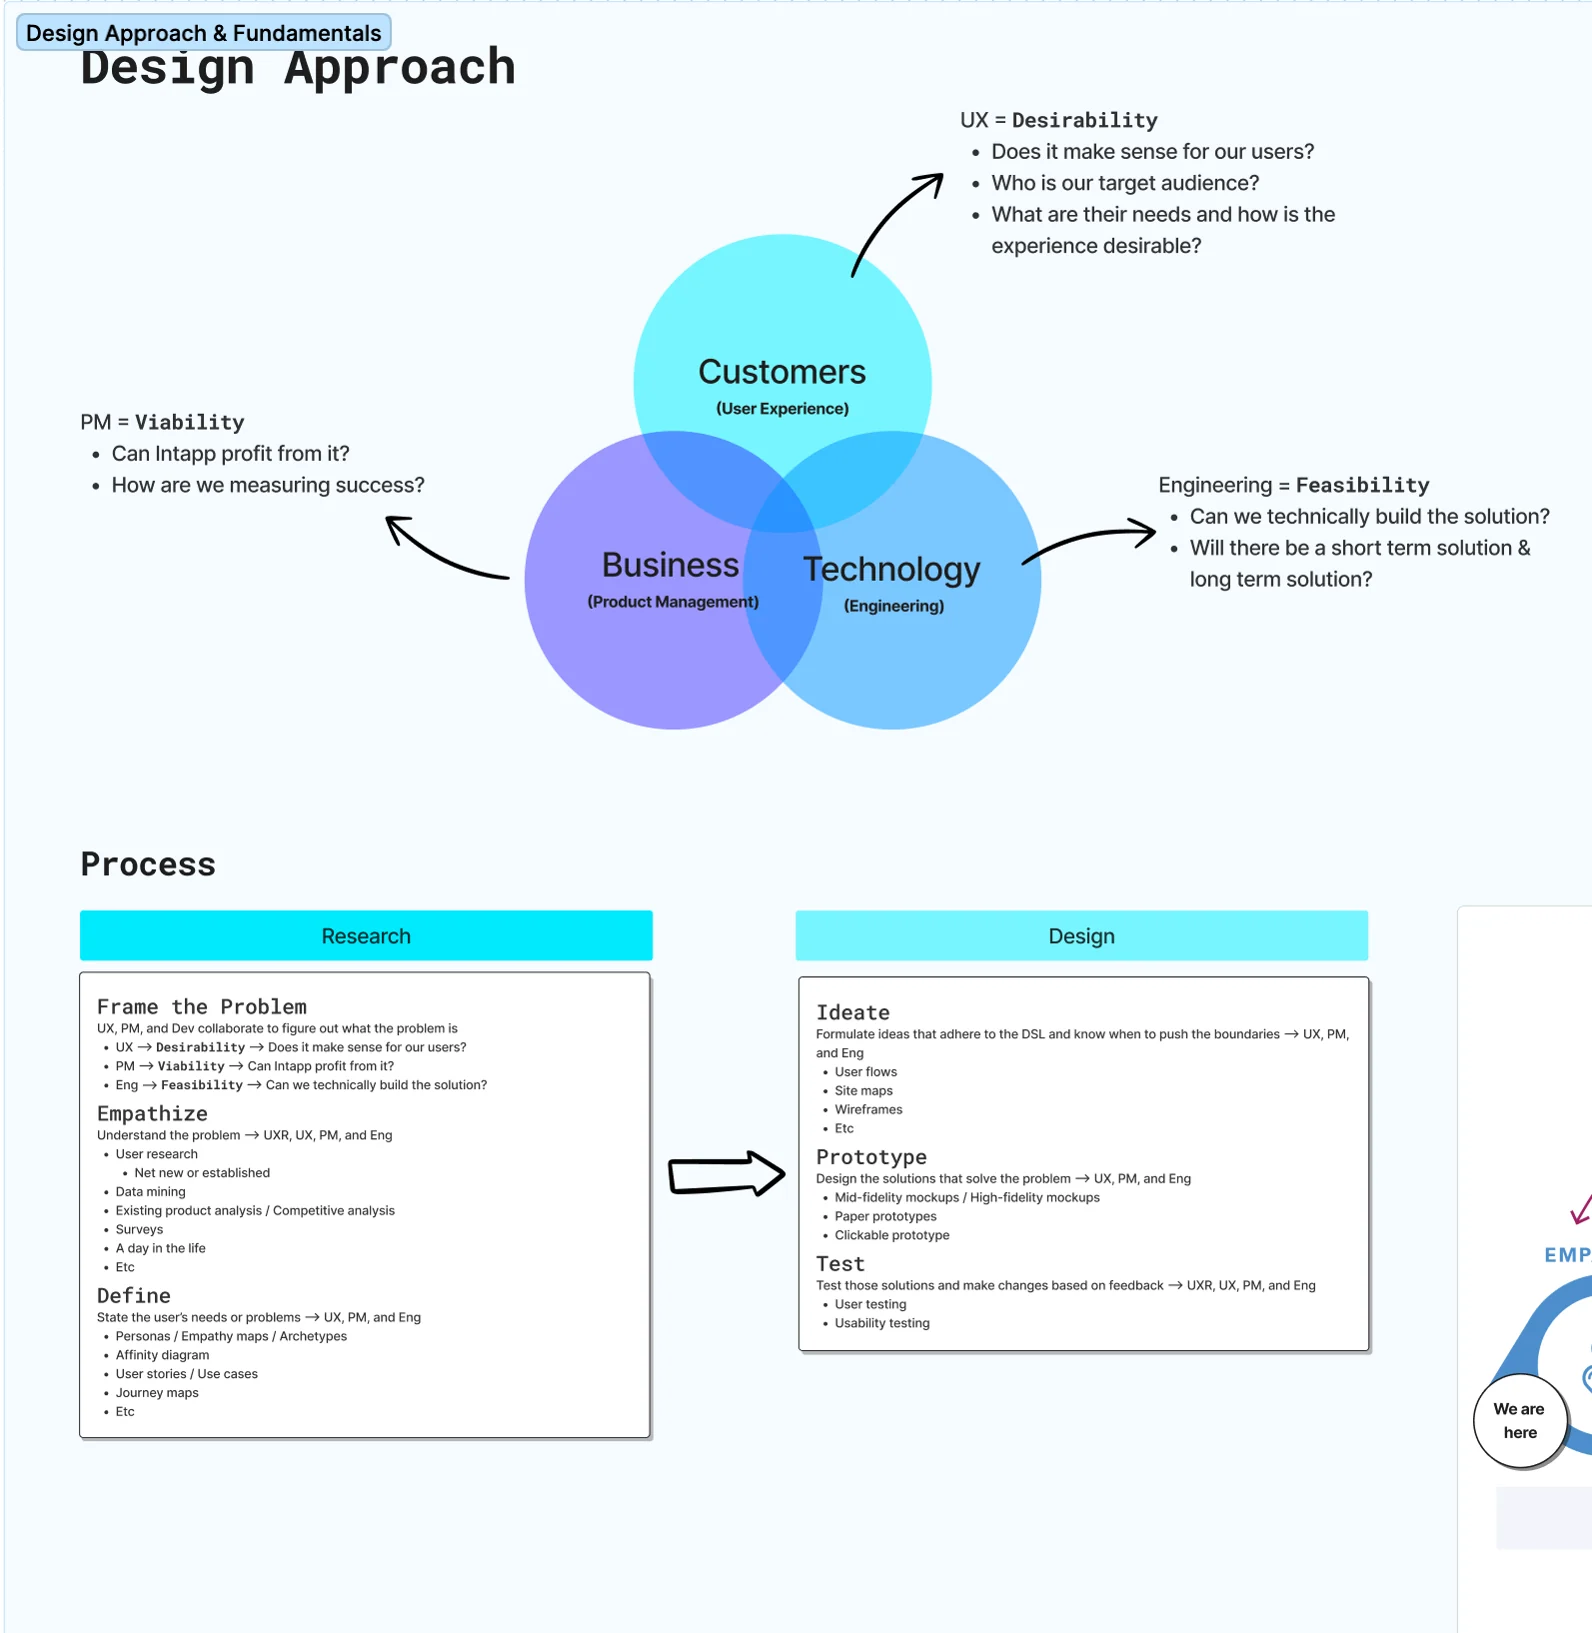
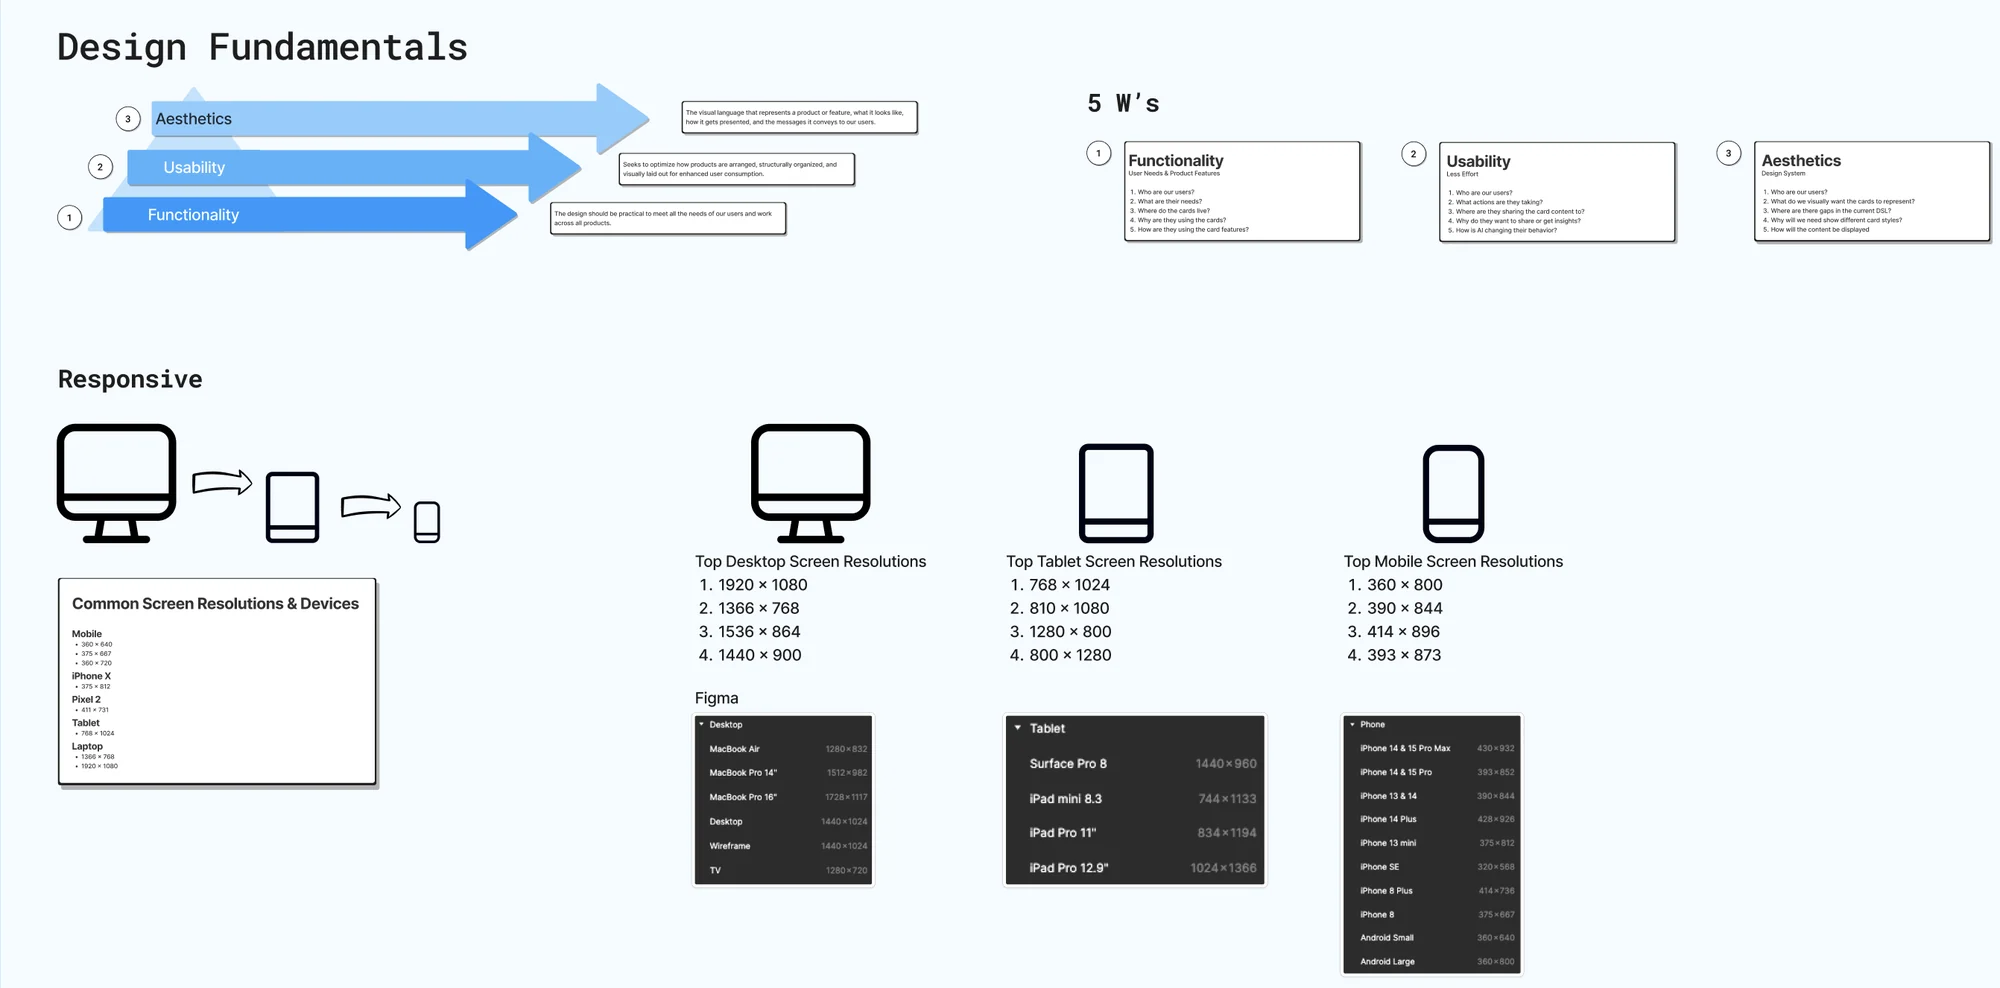
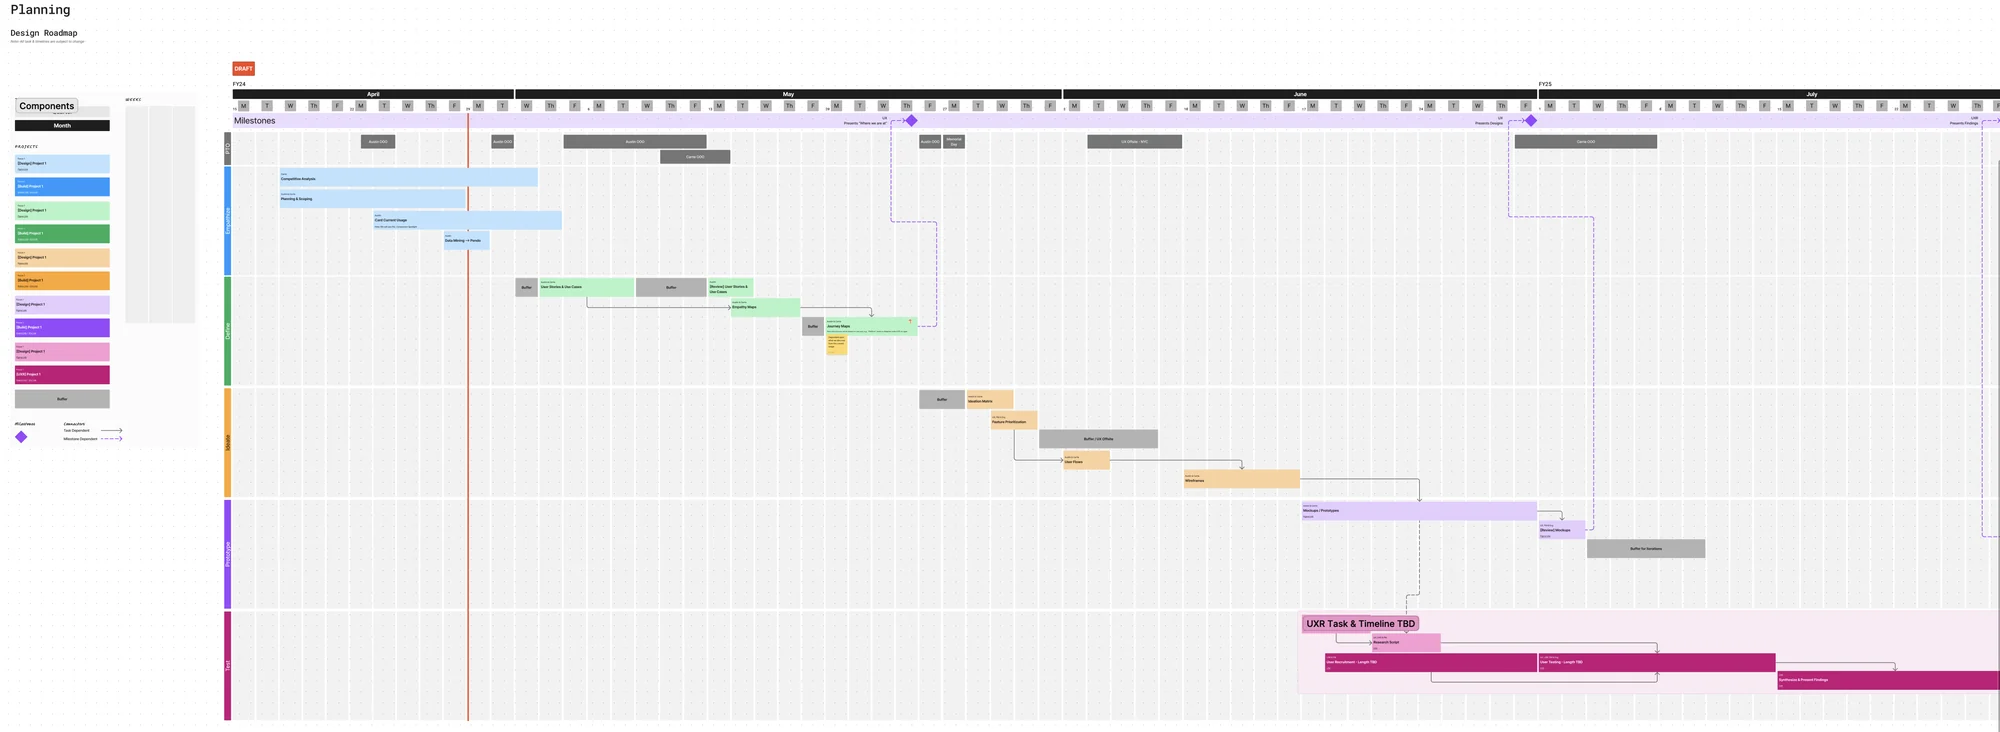
Full size ↗The design approachDesirability, viability, feasibility, each with the question it actually has to answer: does this make sense for our users, can Intapp profit from it, can we technically build it. Underneath, the process split into research and design phases. For an ambiguous brief, agreeing the method is what makes the scope arguable instead of infinite.Full size ↗Fundamentals, kept in viewAccessibility concerns. How will adaptive cards look across every platform? How does our layout change at these breakpoints? A pattern that has to survive both Intapp and Microsoft surfaces is a responsive problem before it is a visual one, so the breakpoints went on the wall early rather than being discovered late.Full size ↗Design process roadmapHow often will we check in, how will we assign work, which tools will we use. The Senior Designer built this and we ran weekly check-ins against it, with Asana tracking how many tasks each piece actually took. Rough planning up front is cheap; discovering in July that nobody agreed on cadence is not.
Discover
Who it is for, and what they already do
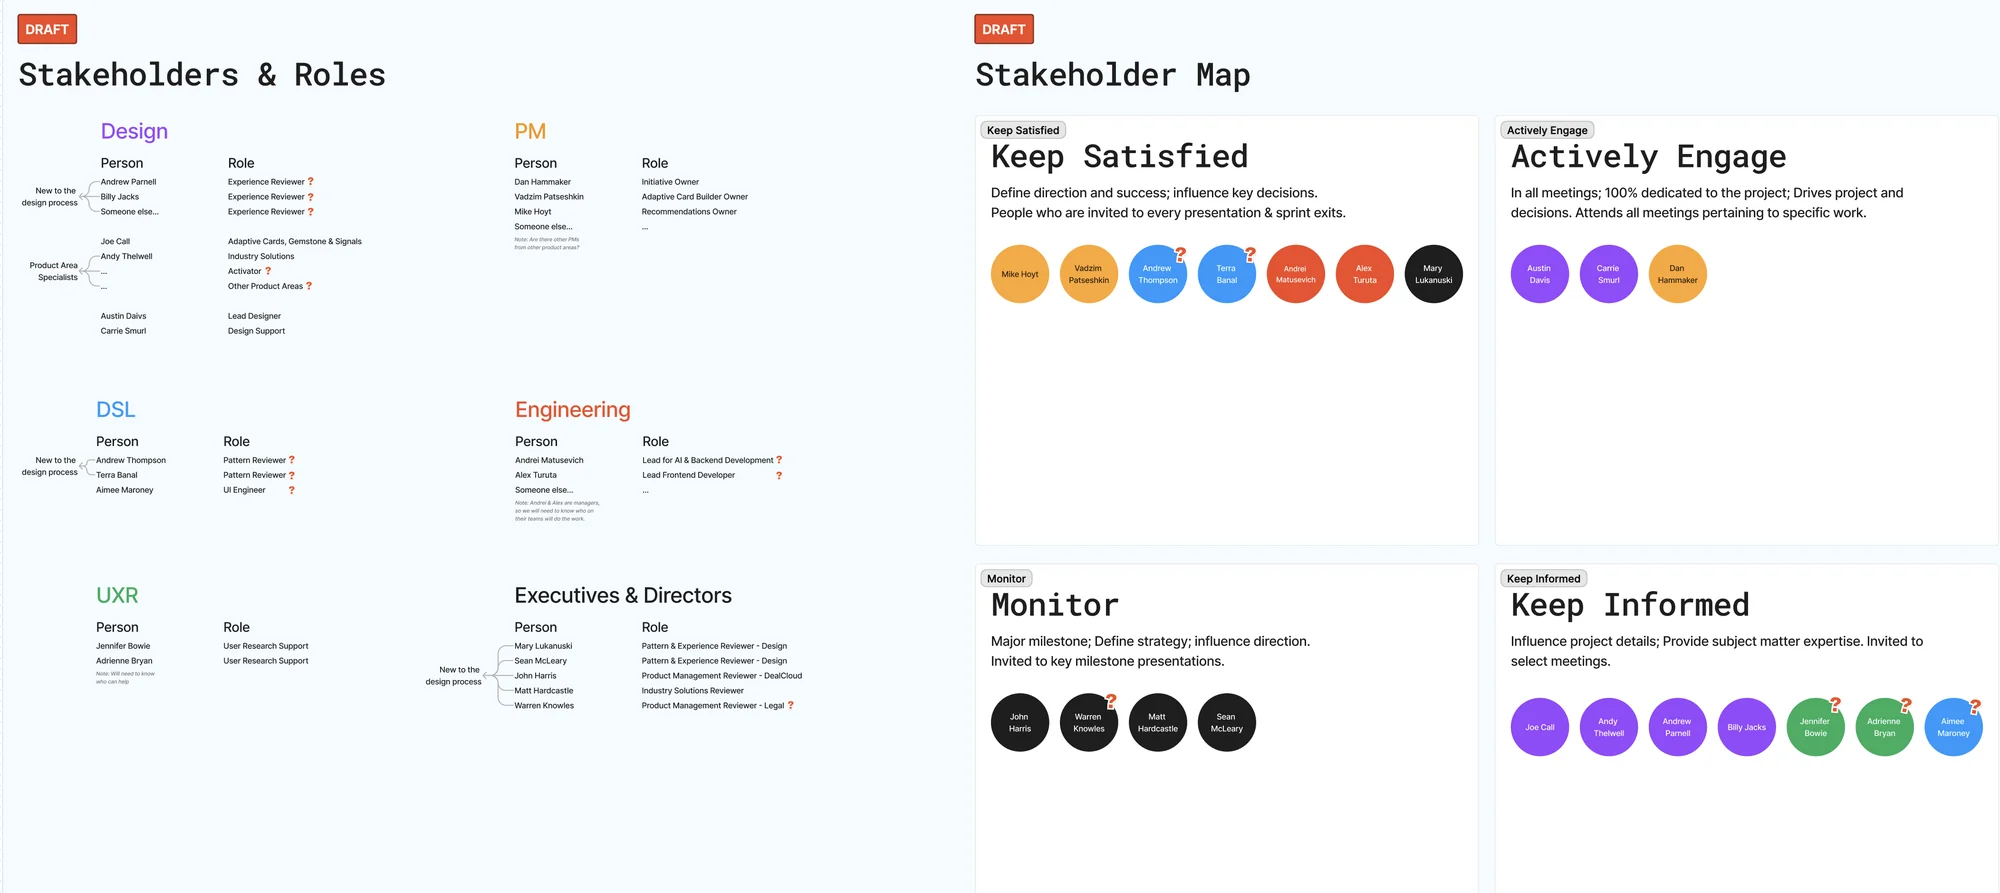
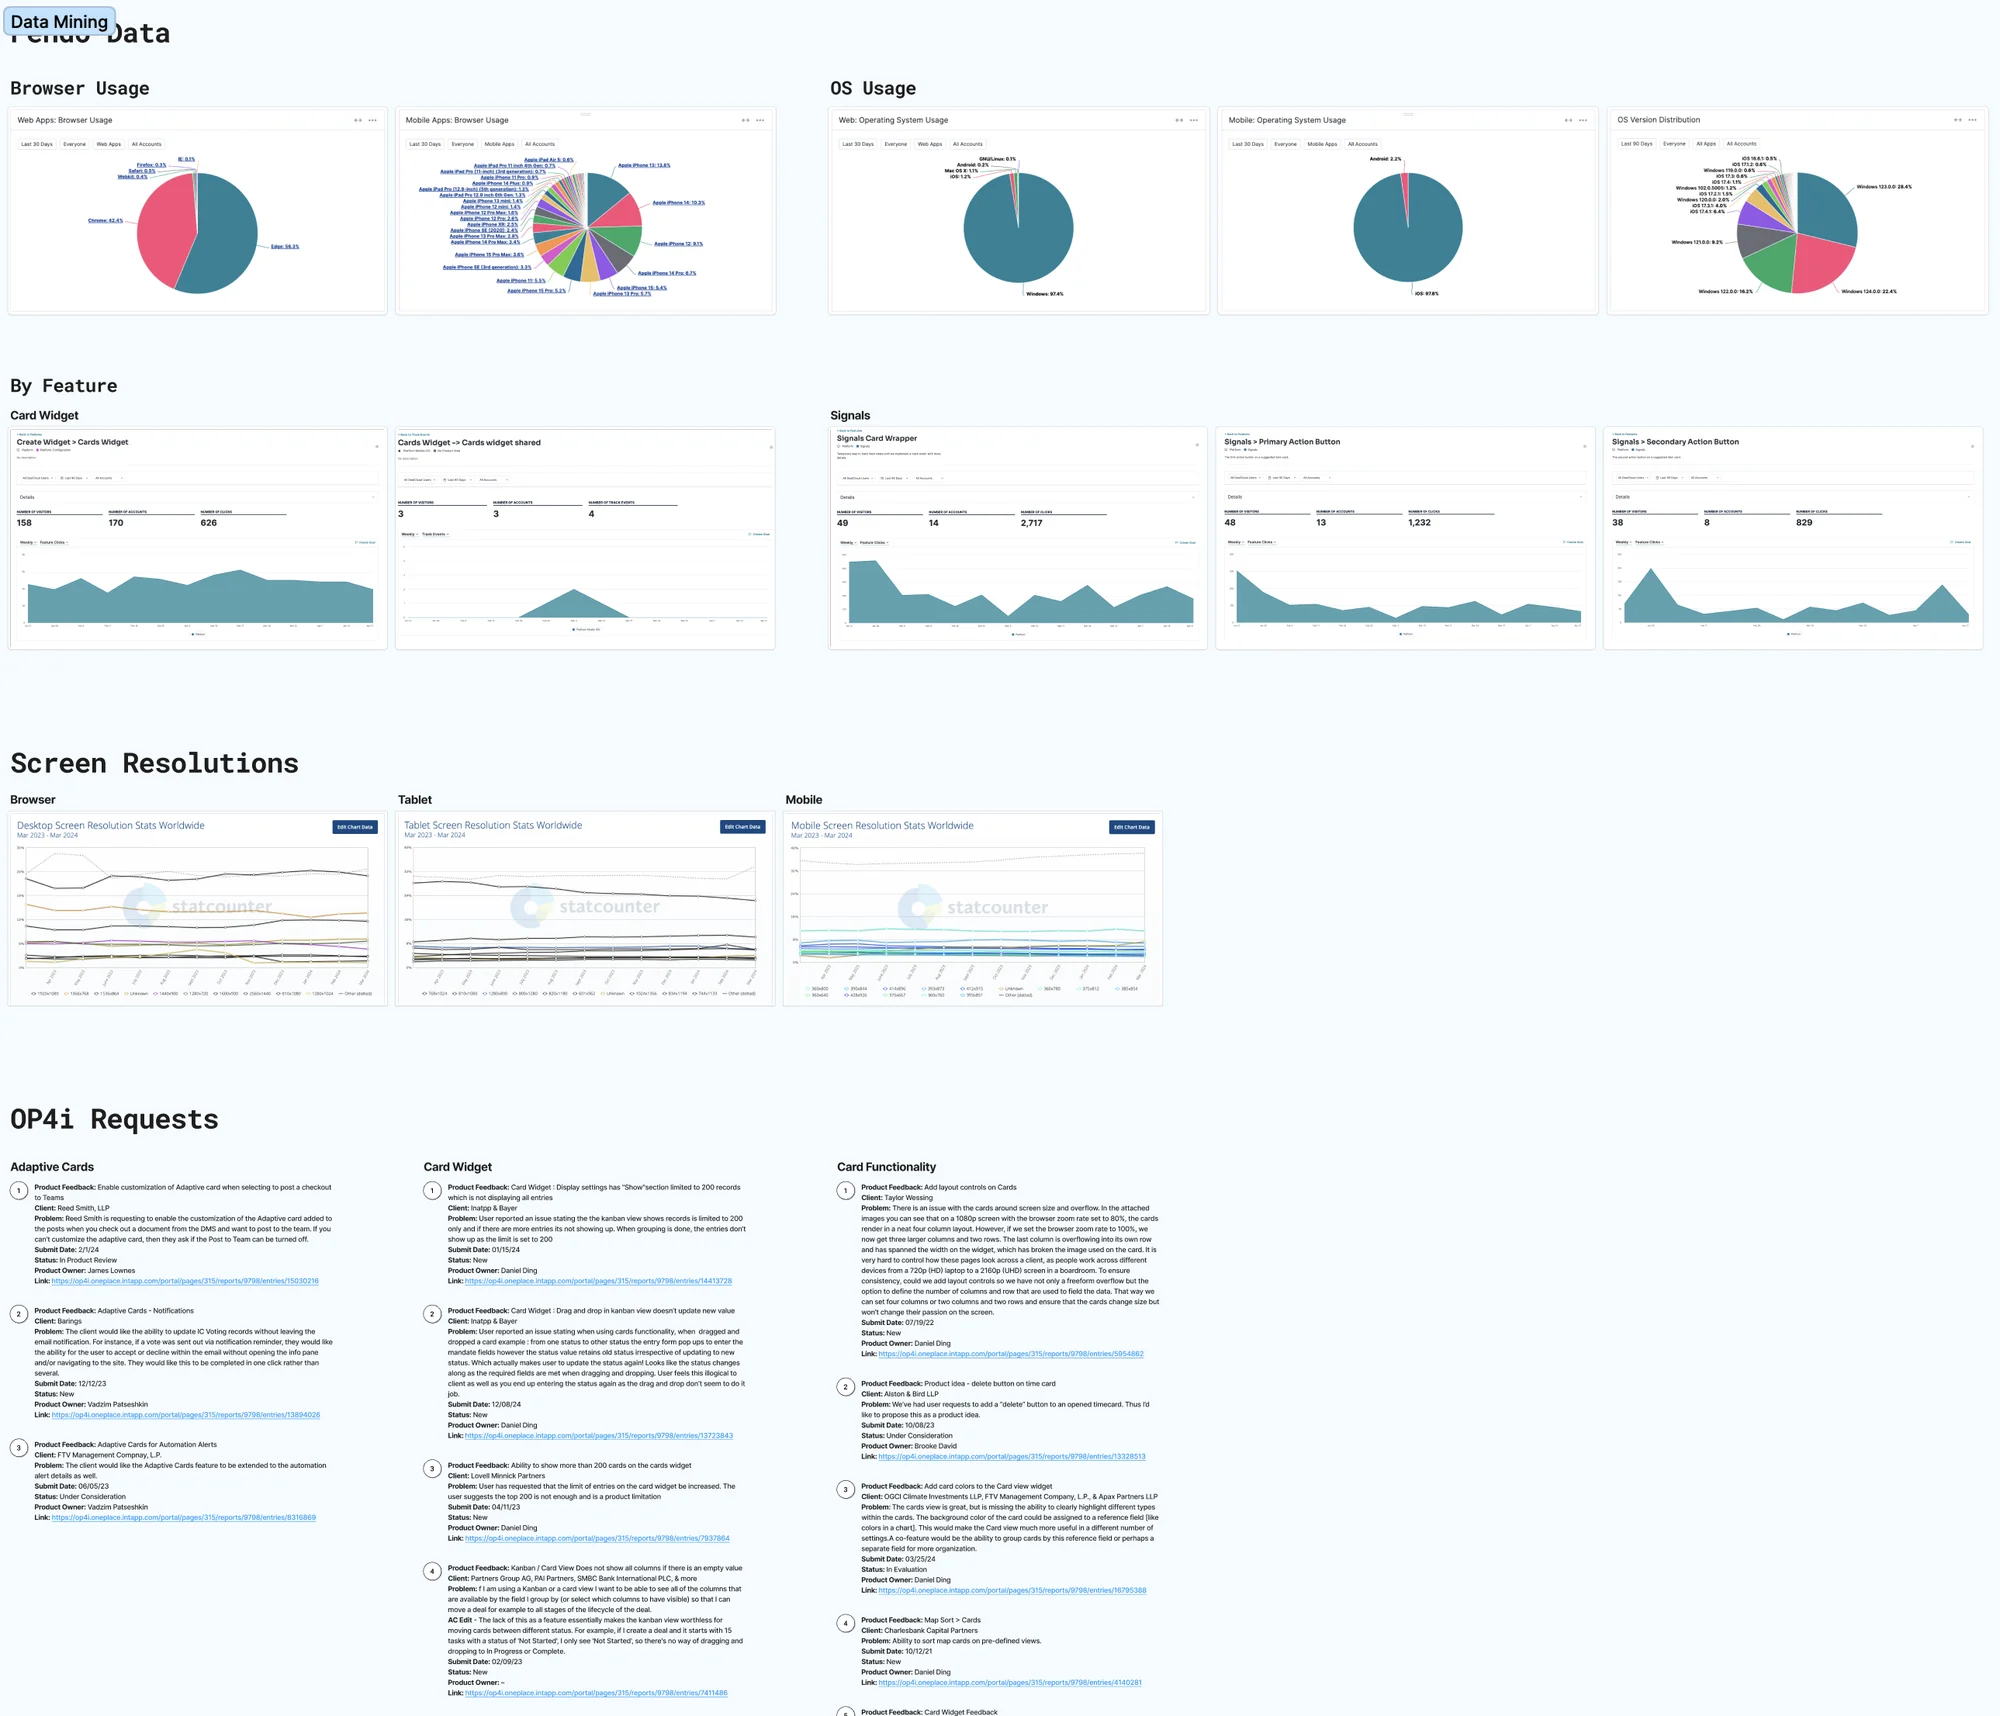
Full size ↗Stakeholders and influenceRoles on the left, influence on the right — who to actively engage, who to keep satisfied, who merely to keep informed. On a change that would eventually require the Design Systems team to approve a rename, knowing in advance whose agreement was load-bearing is most of the politics solved.Full size ↗Quantitative baseline — PendoMy partner pulled the data mining in Pendo and the user feedback while I ran the competitive work. Screen-resolution distribution is the unglamorous chart that matters most here: it tells you which breakpoints are real and which are hypothetical, and that decides how many card variants have to exist.
Competitive and comparative analysis
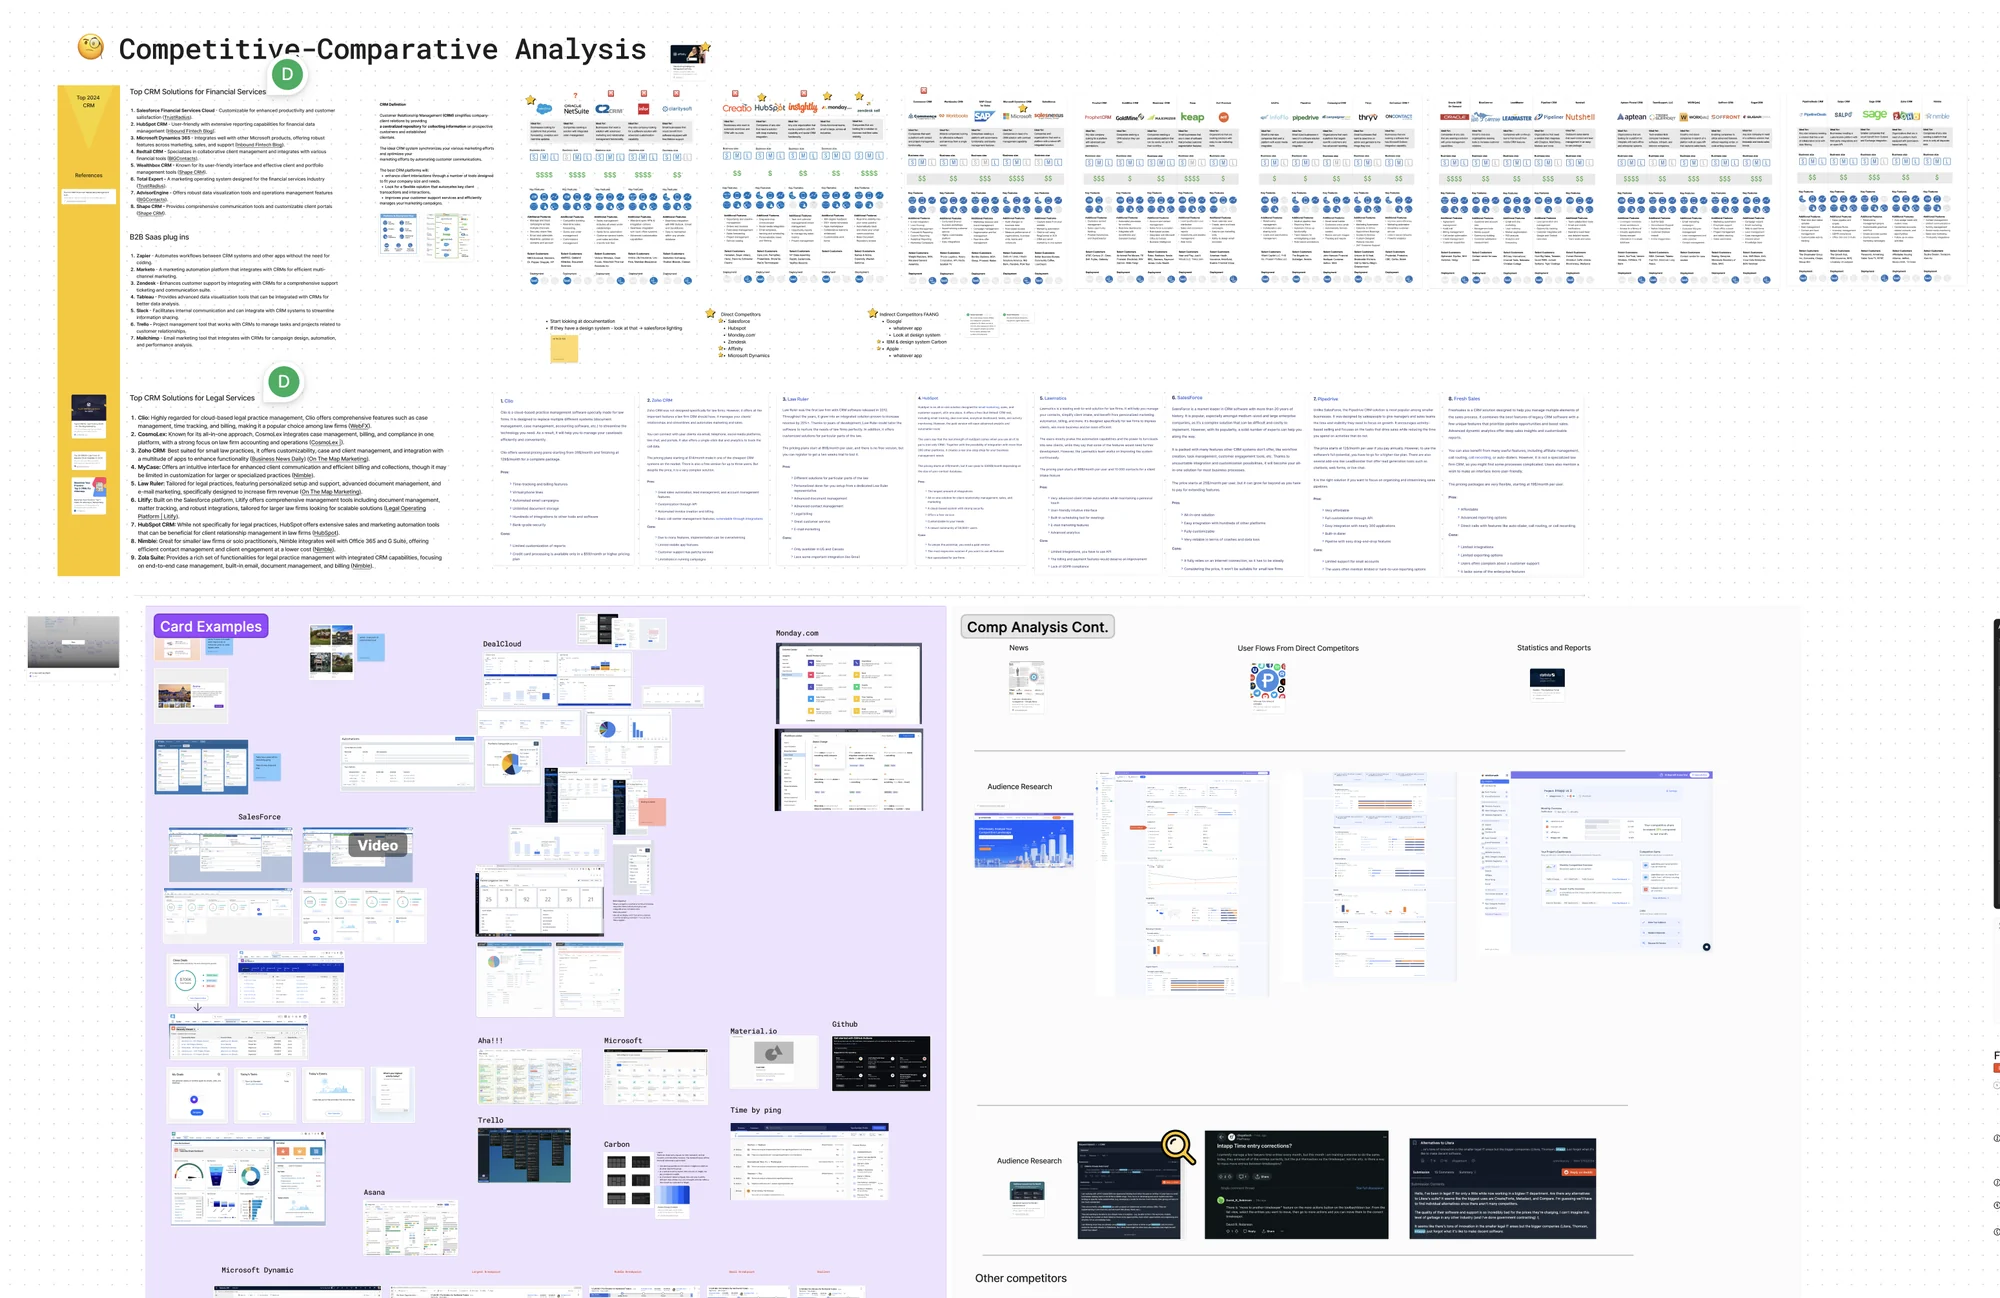
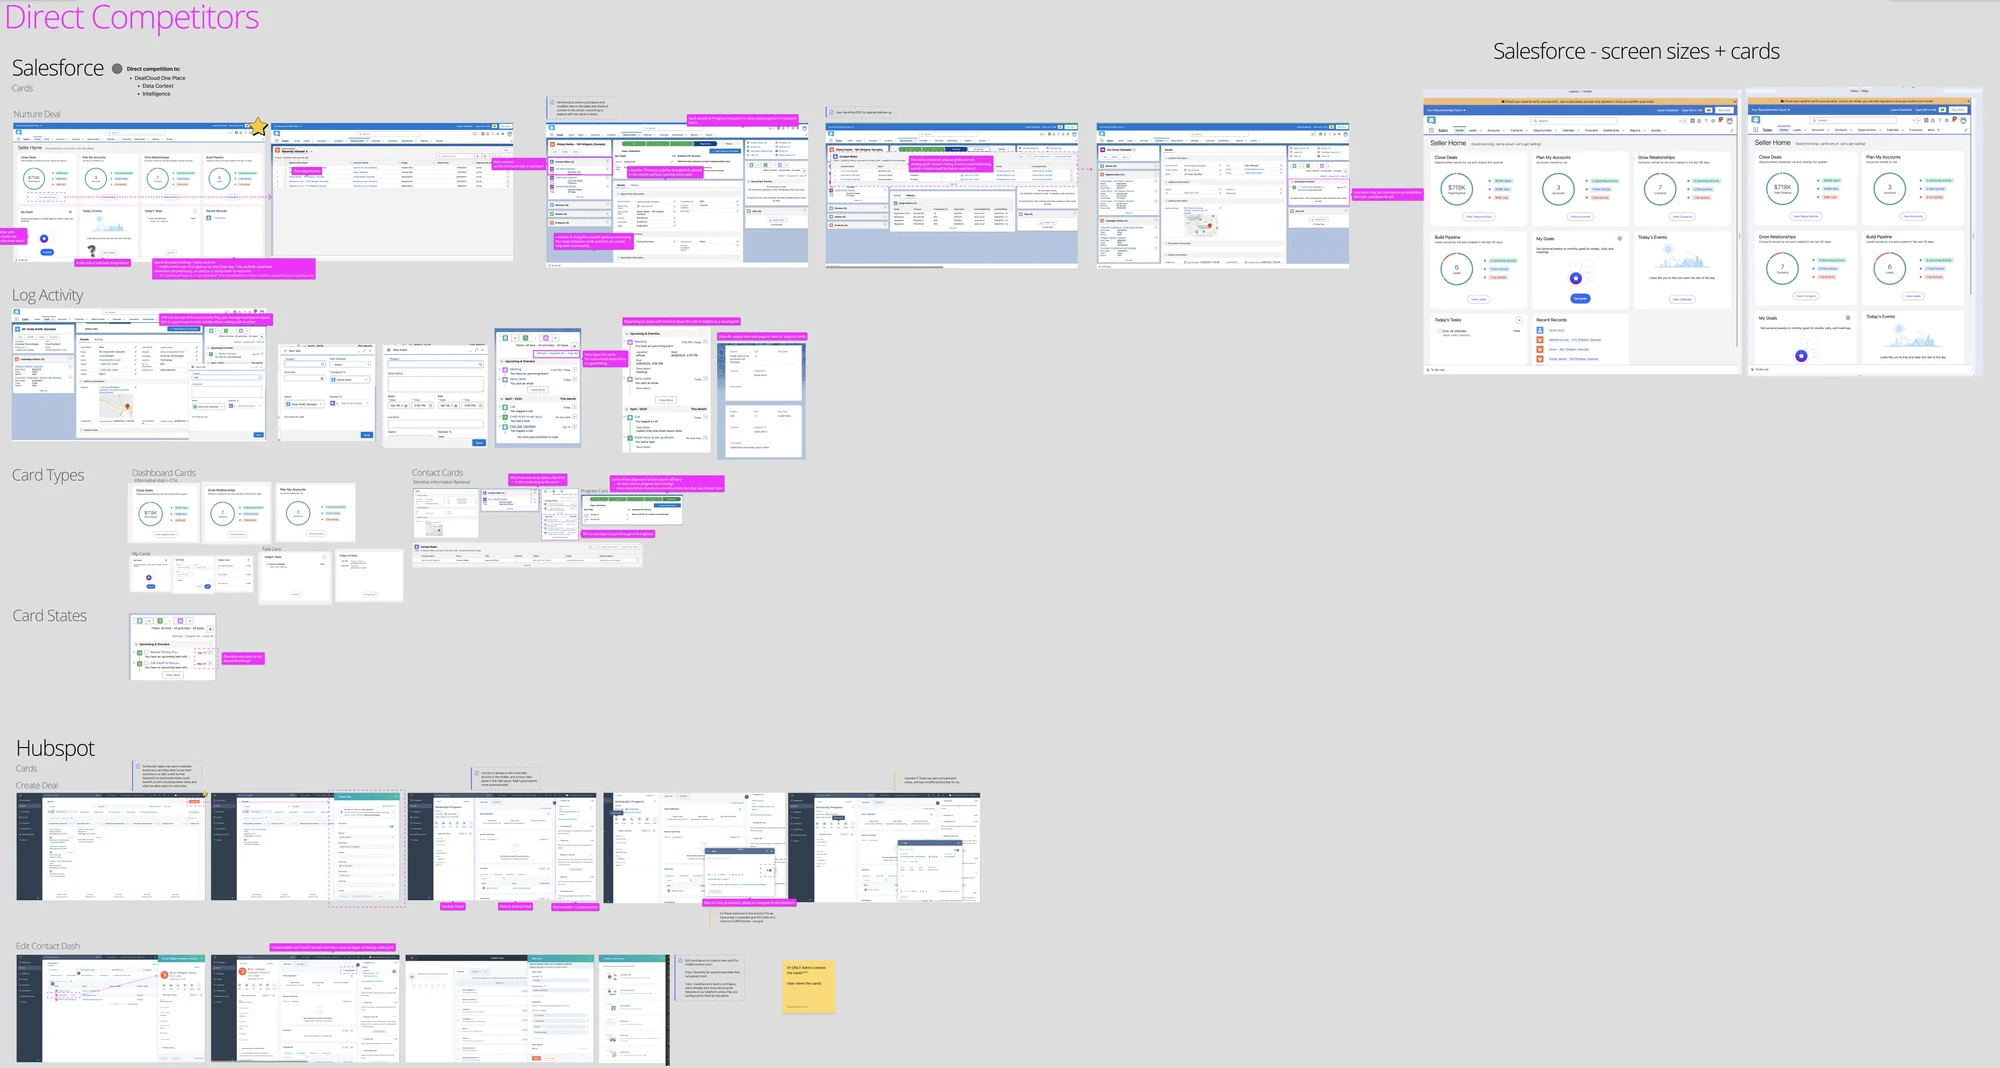
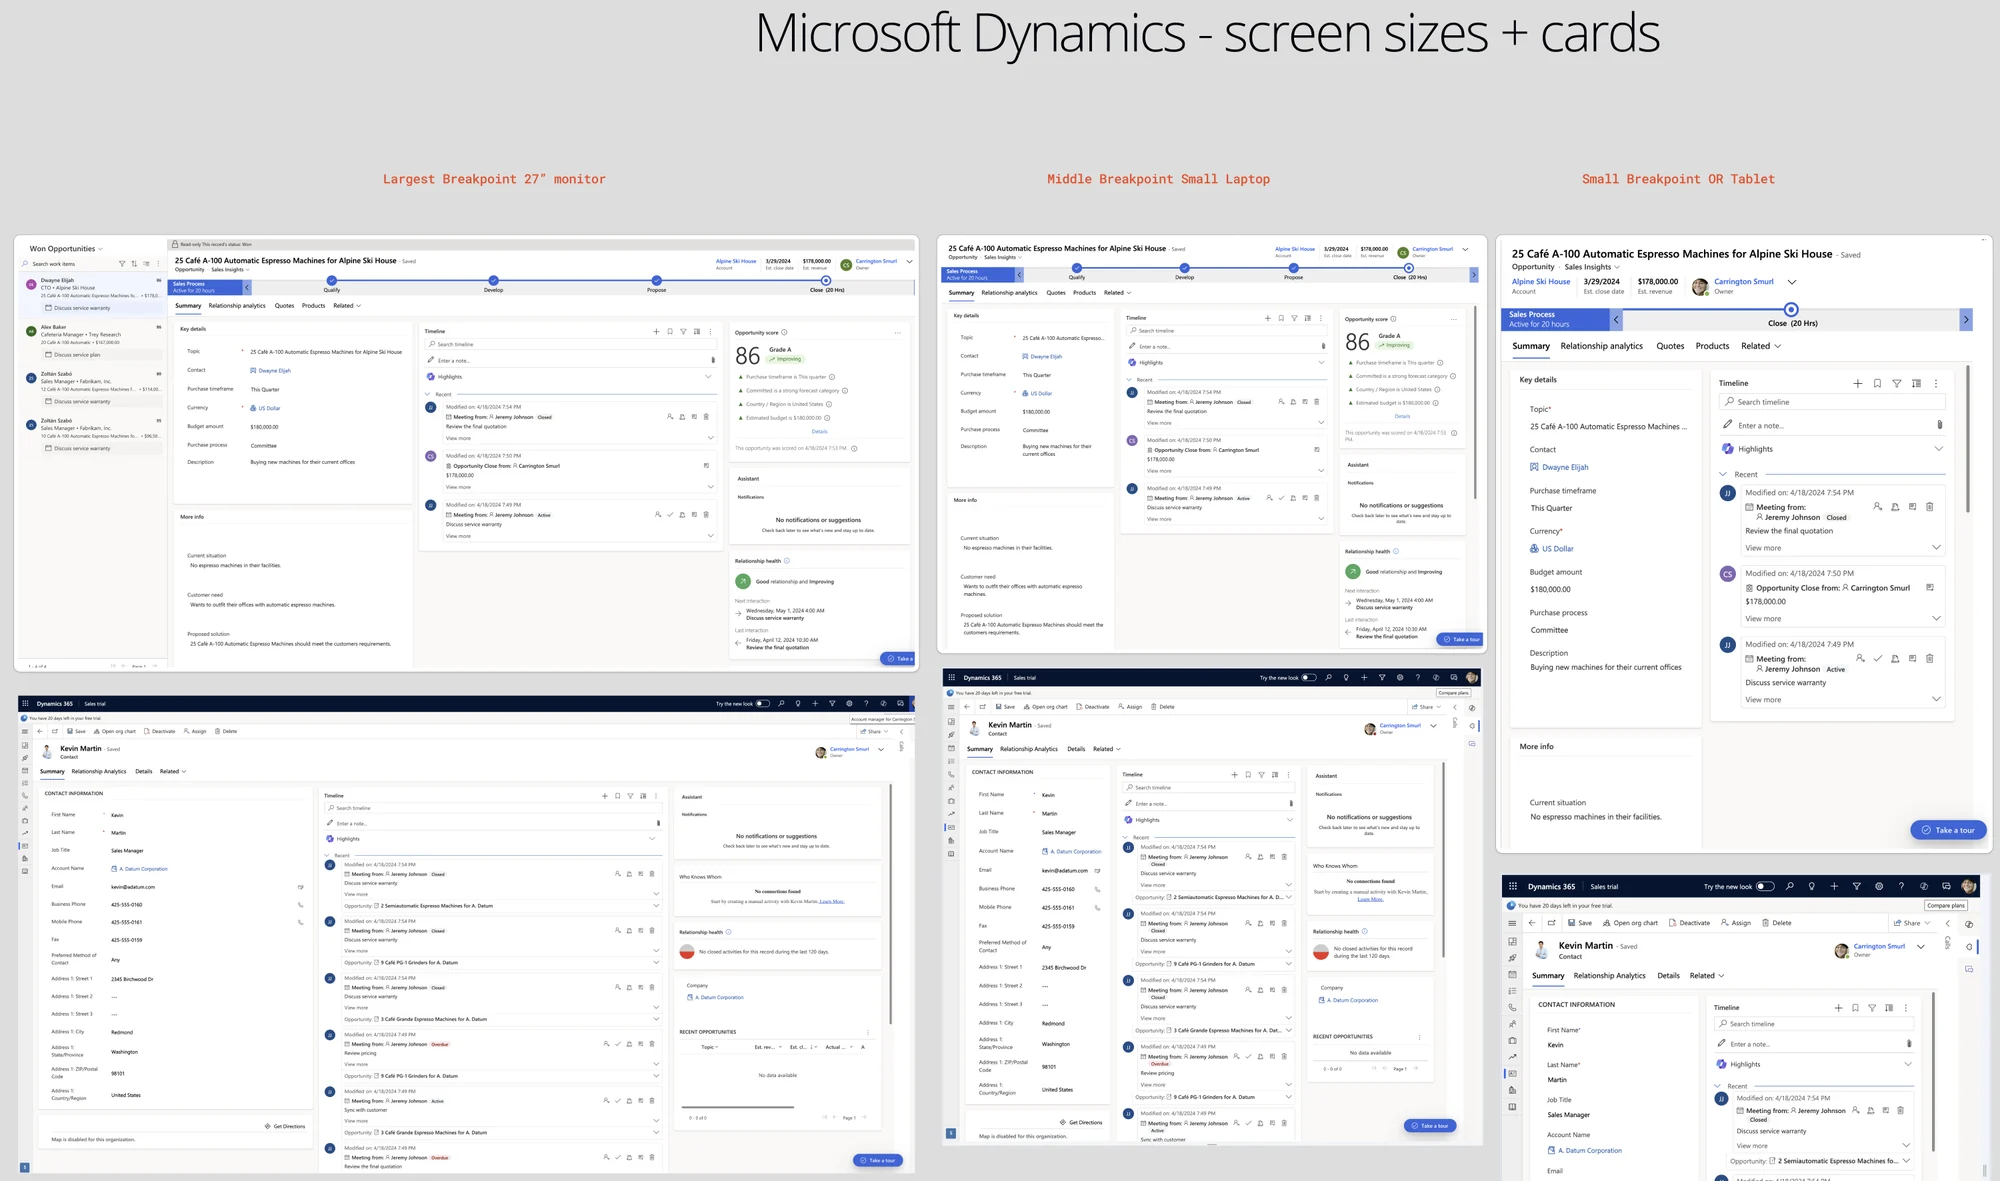
Full size ↗Competitive / comparative analysisDirect and indirect competitors, pulled in with their card patterns and annotated against heuristics. The question I kept returning to is the boring one that actually mattered — what separates a card from a container, from a tile on a dashboard? Without an answer, “unify the card pattern” has no test for success.Full size ↗Direct competitors, annotatedAnnotating rather than collecting. A screenshot wall proves you looked; the callouts are what turn it into an argument about which conventions are shared and which are one company's habit.Full size ↗Microsoft Dynamics at three widthsMicrosoft got its own study, because this pattern had to live inside Microsoft channels as well as ours. Designing a component that will be a guest in someone else's product means their conventions are a constraint, not a reference.
Our own current state
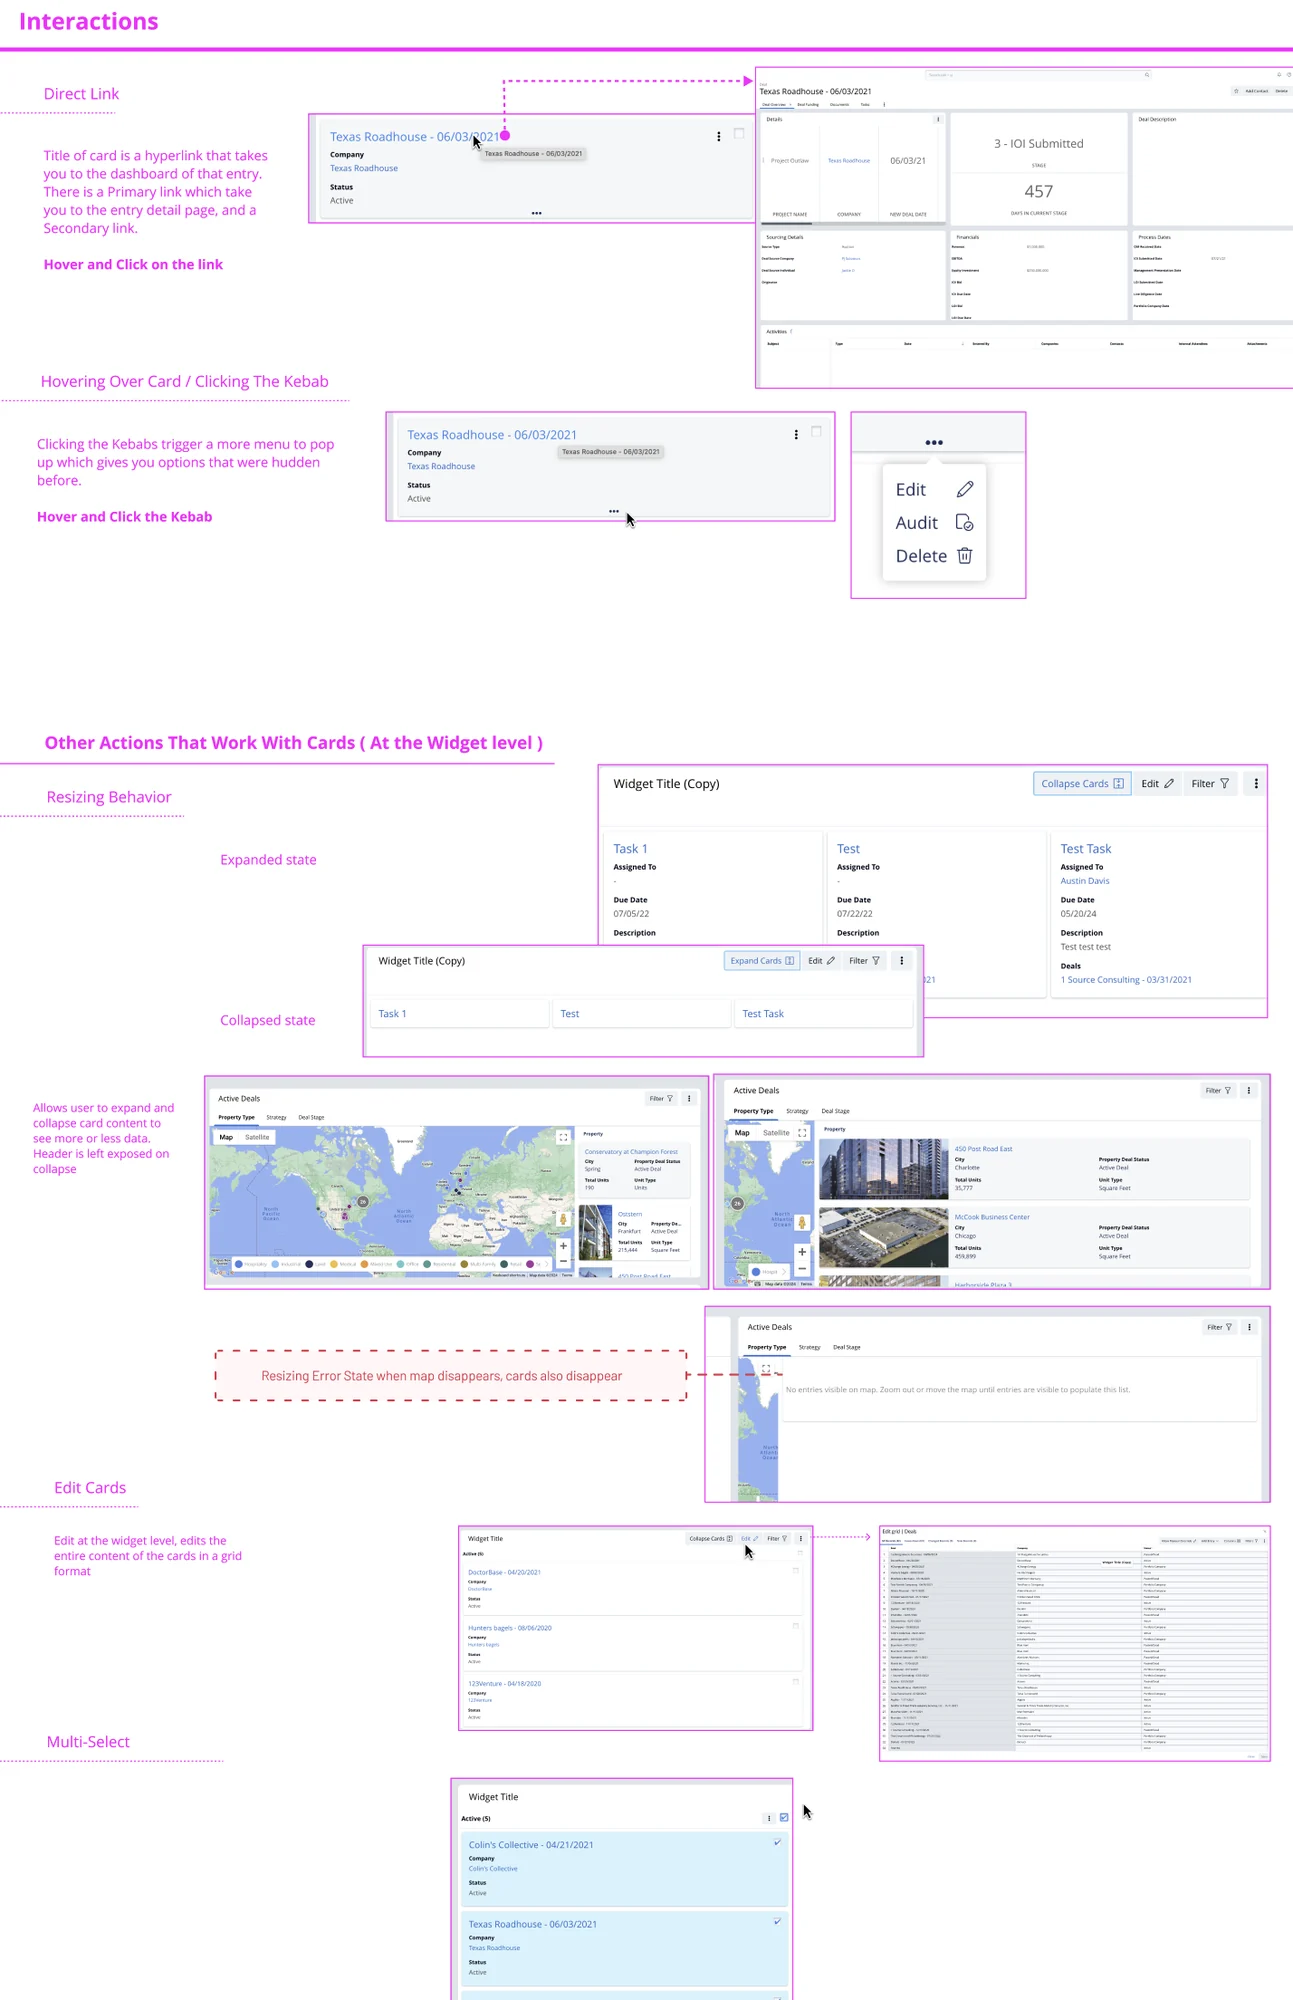
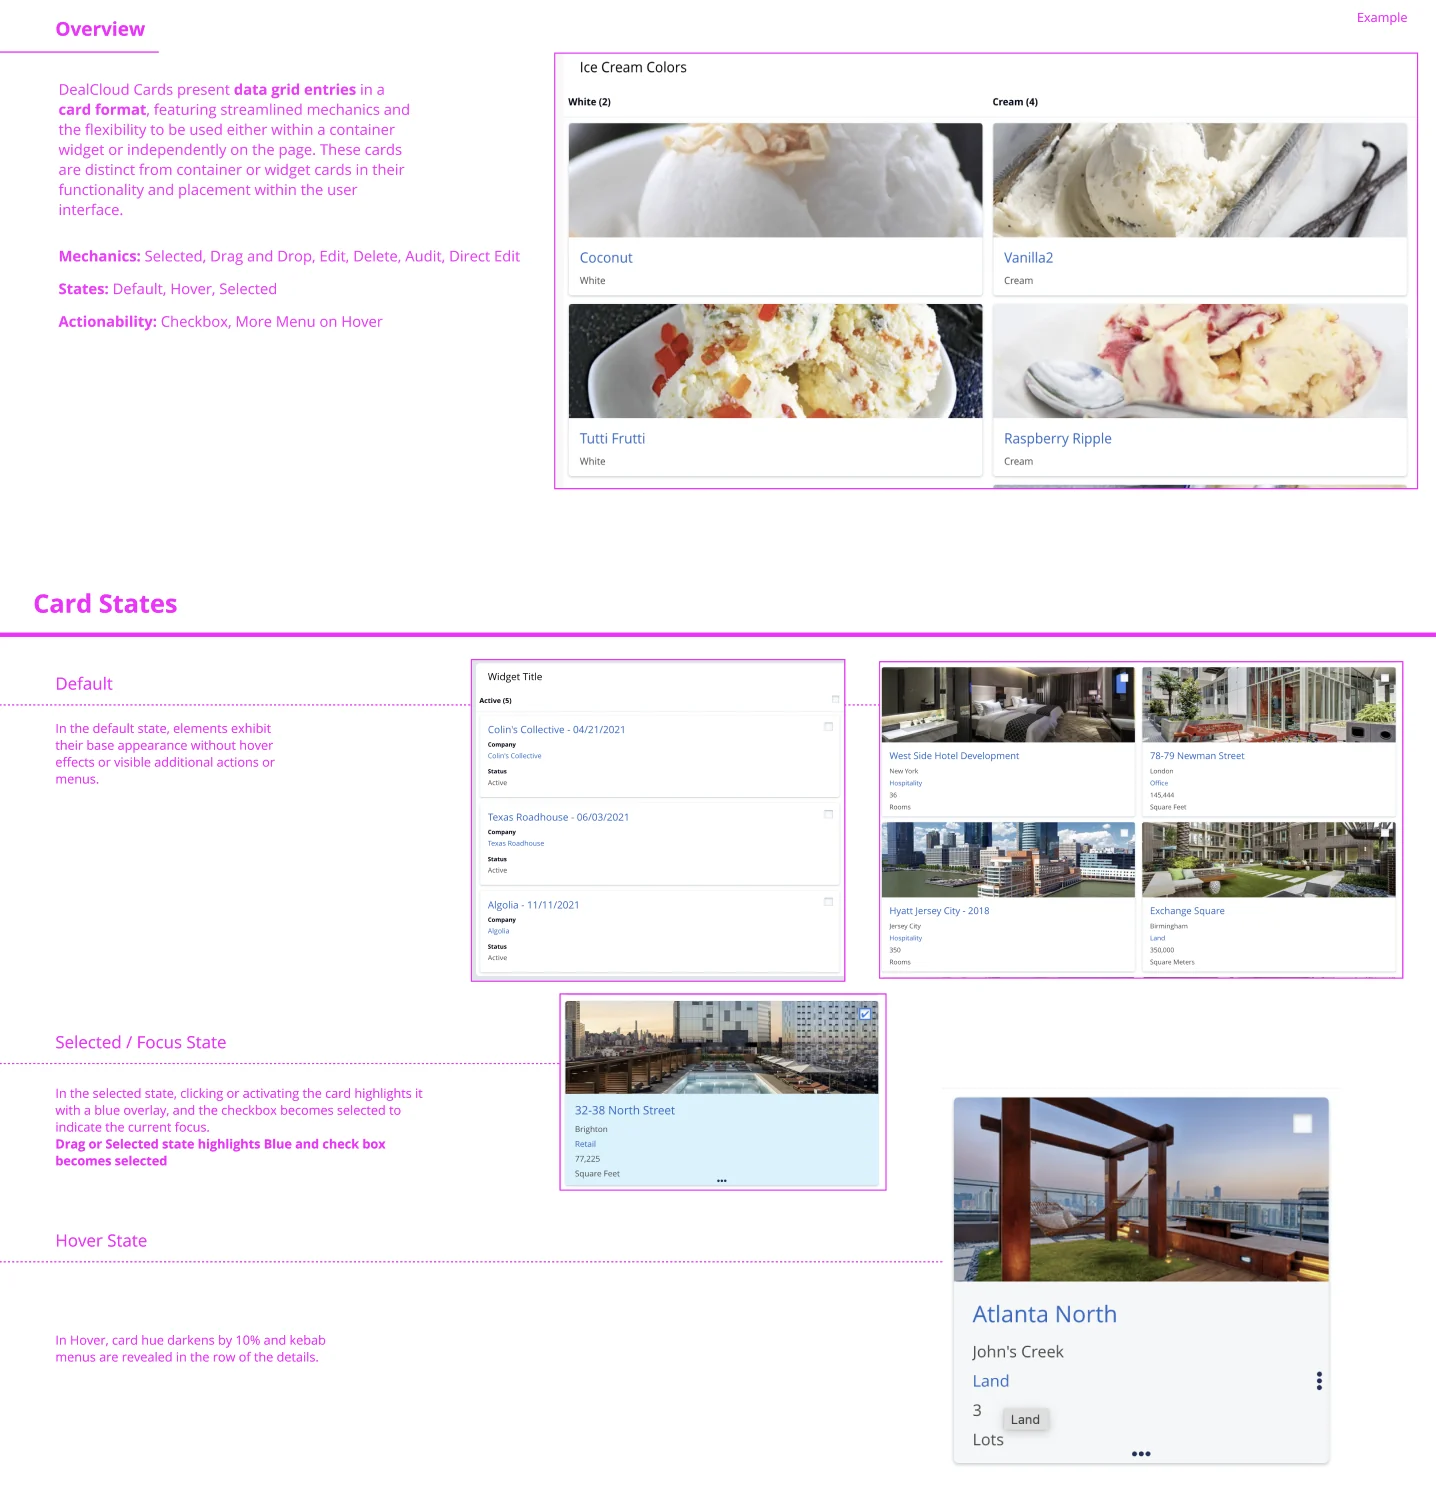
Full size ↗Current card states and interactionsAn inventory of every existing card state and interaction before proposing anything. Unglamorous, and the only way a recommendation survives the question “did you look at what we already have?”Full size ↗Spec of current functionalityDefault, selected, focus, hover — each state written down with the behaviour attached. Before you can agree what a card should be, somebody has to be able to say what it currently is, and that document did not exist.
Define: the word was the problem
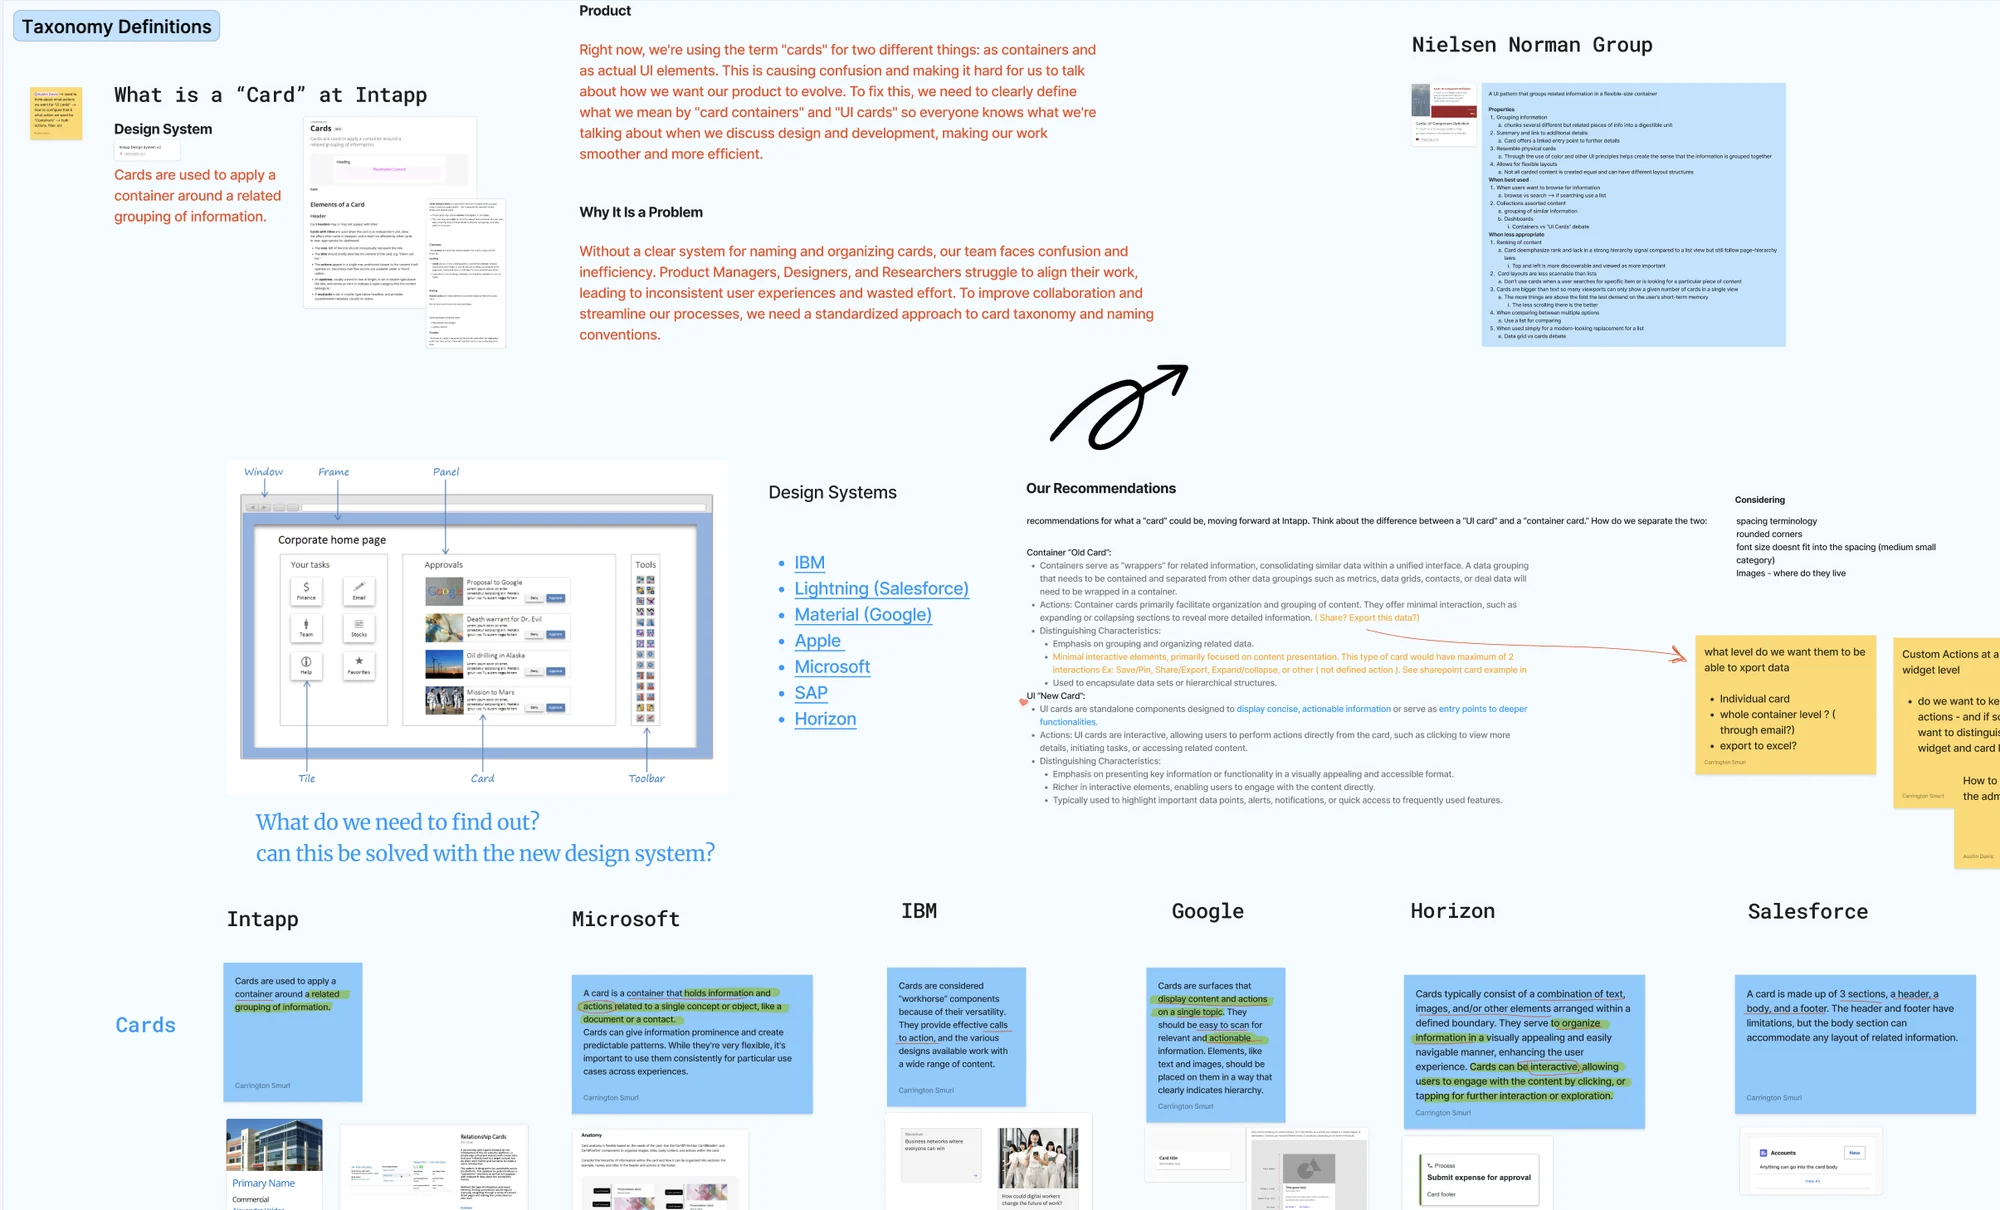
Full size ↗Taxonomy definitionsDesign systems laid side by side — Intapp, Microsoft, IBM, Google, Hubspot, Salesforce — each with its own definition of a card, highlighted for where they agree. The diagram separates window, frame, panel, tile, card and toolbar, because half the disagreement was people naming different objects with the same word. This board is the argument that the rename was necessary, which is what made it survivable with stakeholders.
The recommendation was to split the overloaded term in two:
Container — the old “card.” A wrapper that consolidates related information into a
unified interface. Organises and groups; minimal interaction beyond expanding or collapsing.
UI card — net new. A standalone component presenting concise, actionable information, or
acting as an entry point into deeper functionality. Interactive by definition.
I wanted to be certain the recommendations would still be appropriate once cards were renamed
to containers and “card” became a net-new thing — which is a harder test than it sounds,
because it means every existing usage in the system has to resolve cleanly under the new names.
Define: three user bases, one component
To understand how cards should behave on a dashboard, I worked through the archetypes across
Intapp’s three user bases — Private Equity, Legal, and Real Estate. I pulled from prior
research documentation and the ACTIVATOR persona our research team had validated earlier
that year, went to research office hours with questions, and spoke with internal
subject-matter experts to pressure-test my assumptions.
I also reached out through my own network for an interview with a private equity user, because
the internal picture had gaps I could not close from documentation.
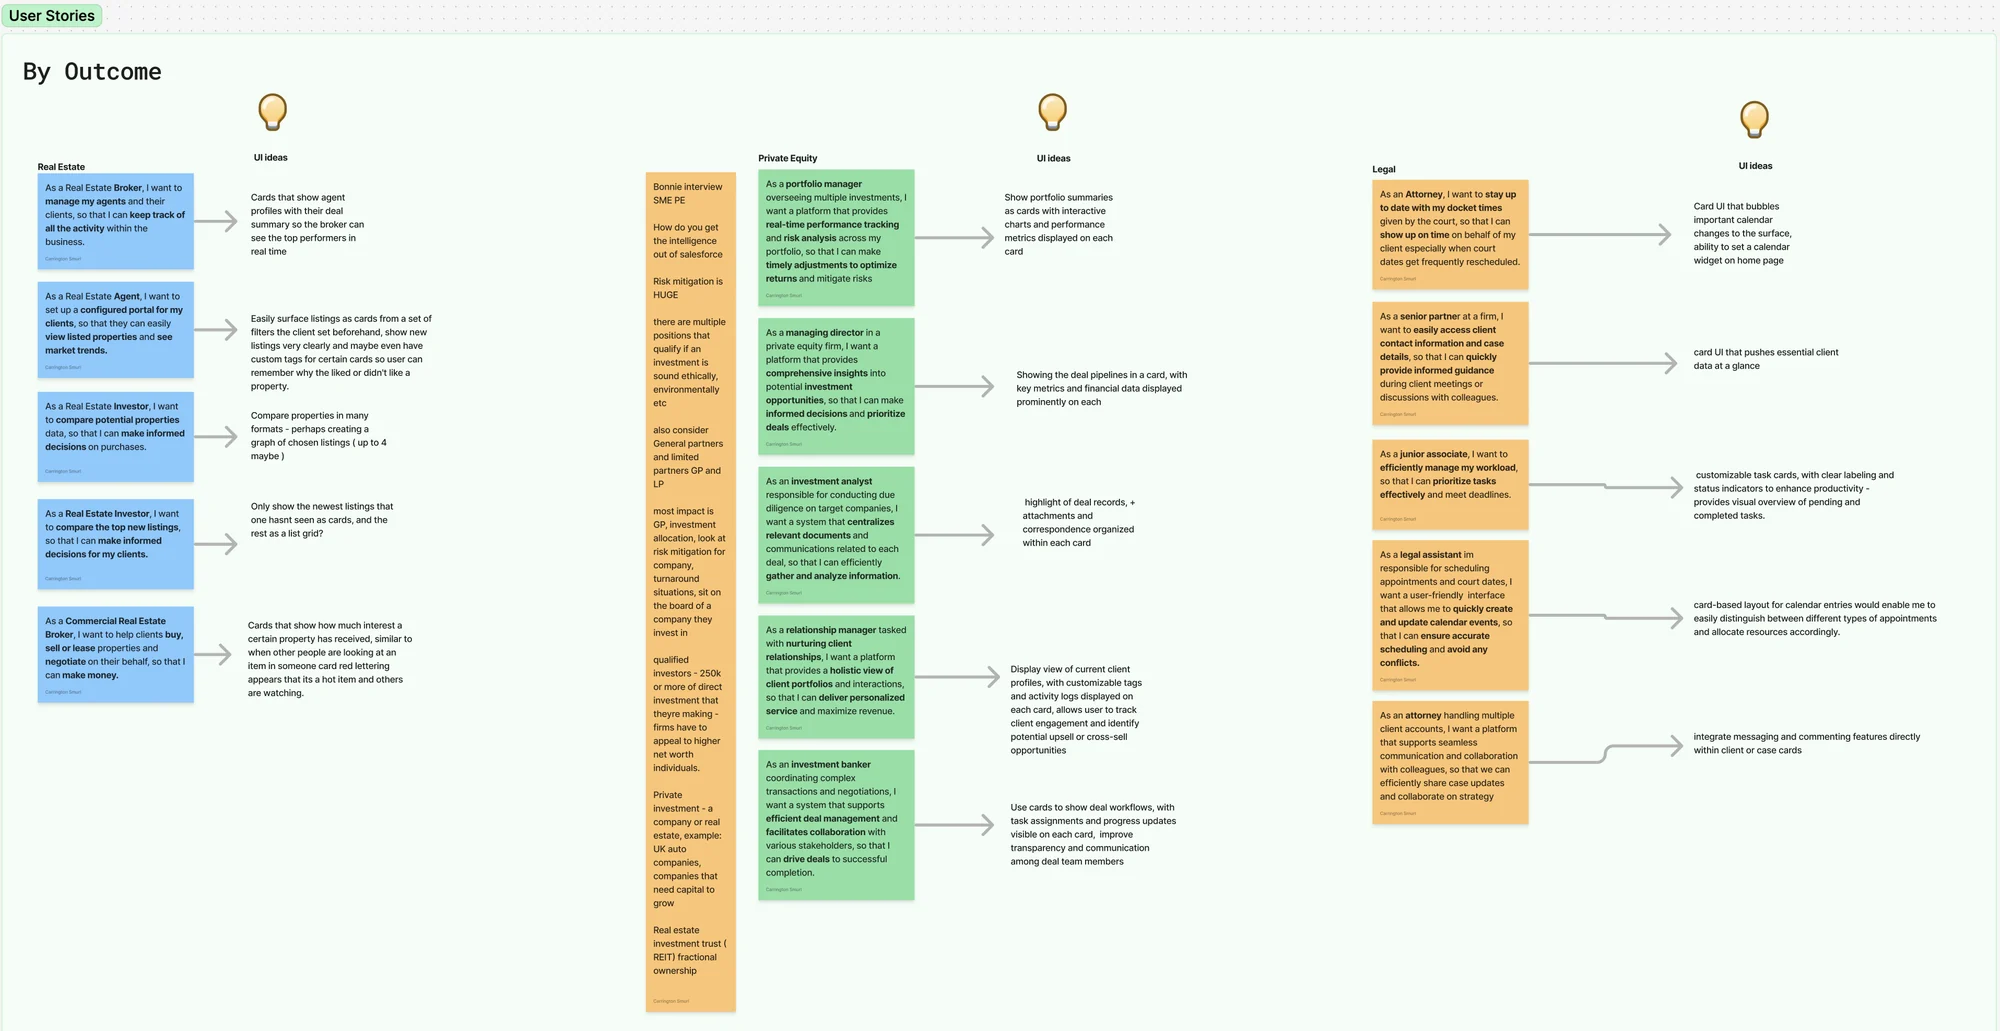
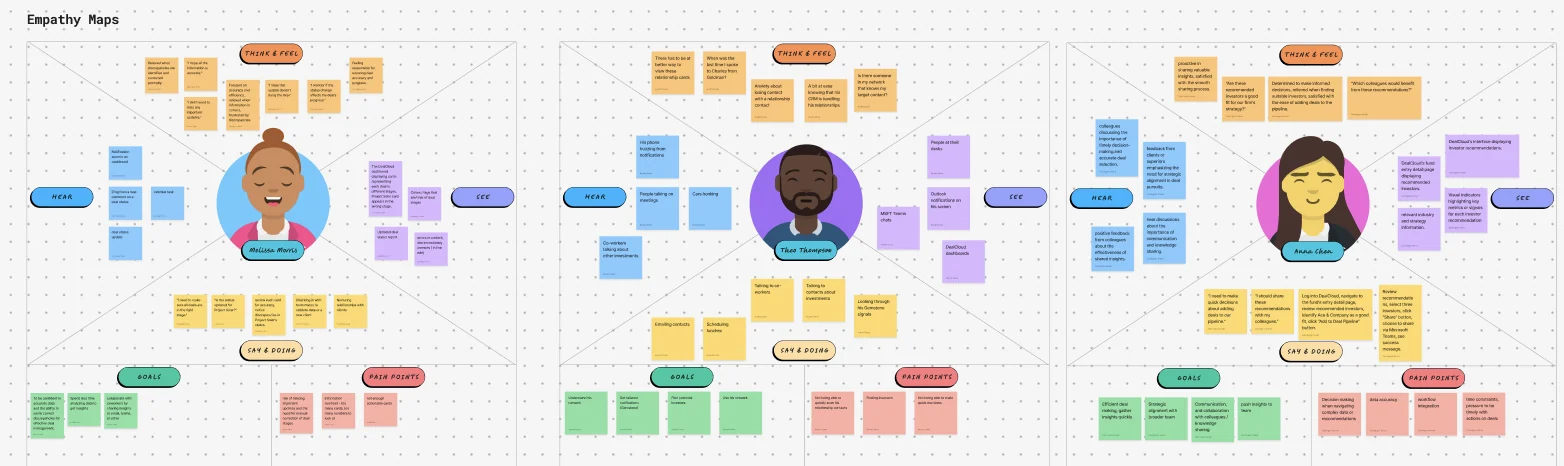
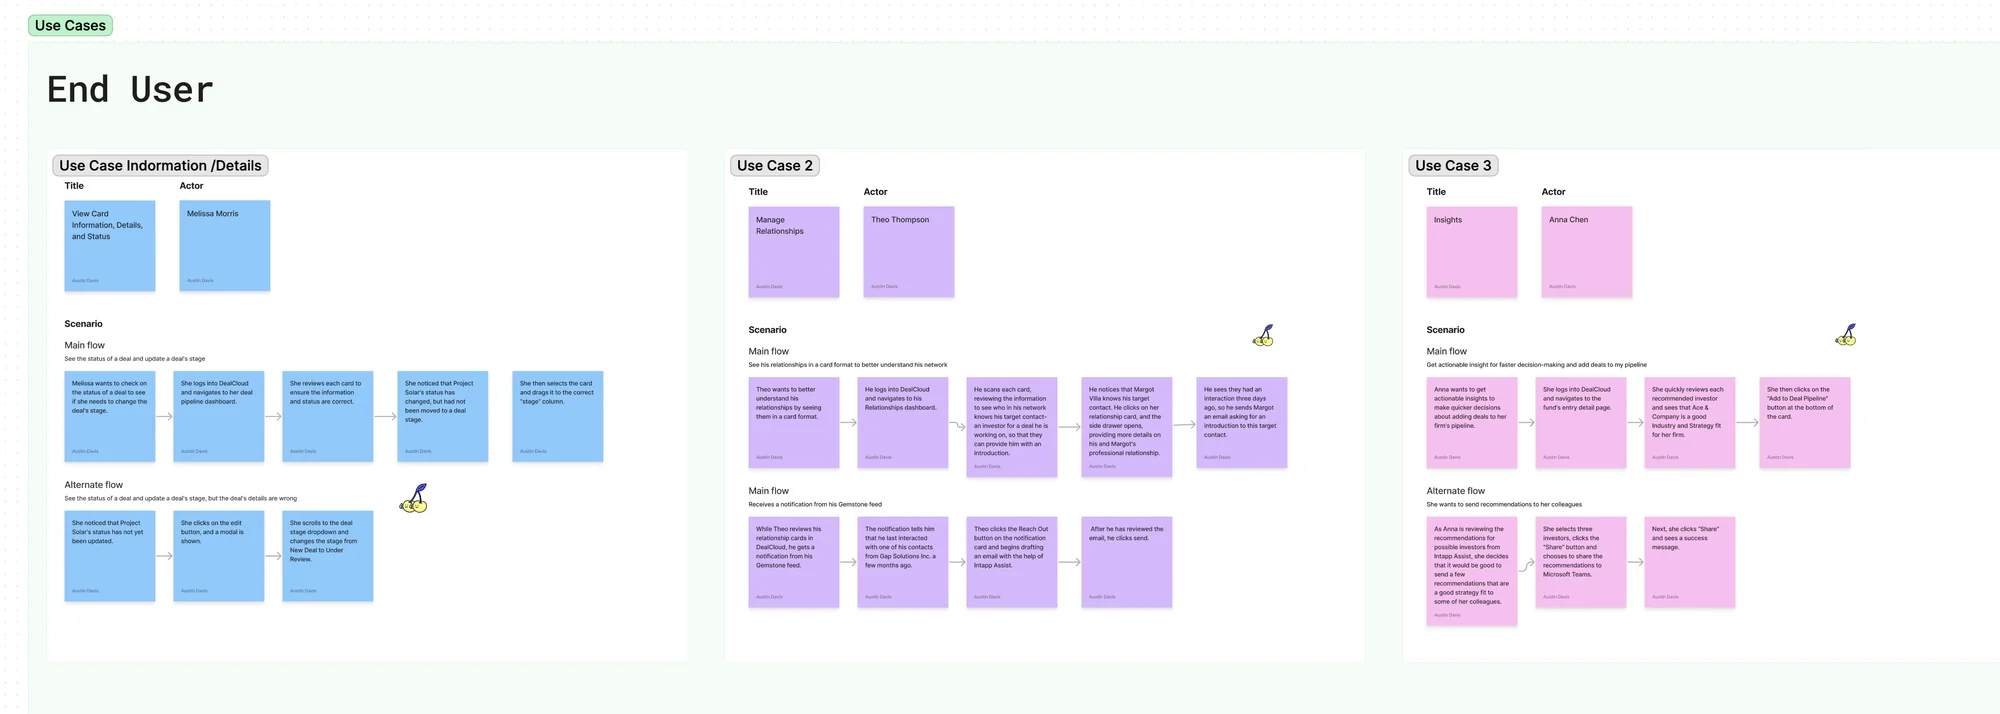
Full size ↗User stories → UI ideasEvery story is paired with the card idea it implies — “as a legal assistant scheduling appointments, I want a user-friendly interface…” becomes “card-based layout for calendar entries.” The orange column on the left is the raw interview with the private-equity SME I found through my own network. Mapping story to idea in one artifact is what stops research becoming a document nobody opens.Full size ↗Three empathy mapsEmpathy mapping narrowed a sprawling set of possibilities down to three use cases worth solving. Narrowing is the deliverable here — an agnostic pattern that tries to serve every case serves none of them.Full size ↗The three use casesThe three we committed to solving, written out as end-user situations rather than features. Everything downstream — the pattern flow, the variants, the principles — gets tested against these three and nothing else.Full size ↗Flows behind the use casesEach use case taken through to the sequence of screens and decisions it implies. This is where an abstract requirement becomes testable: a pattern either carries these flows or it does not.
The rule that outlives the project
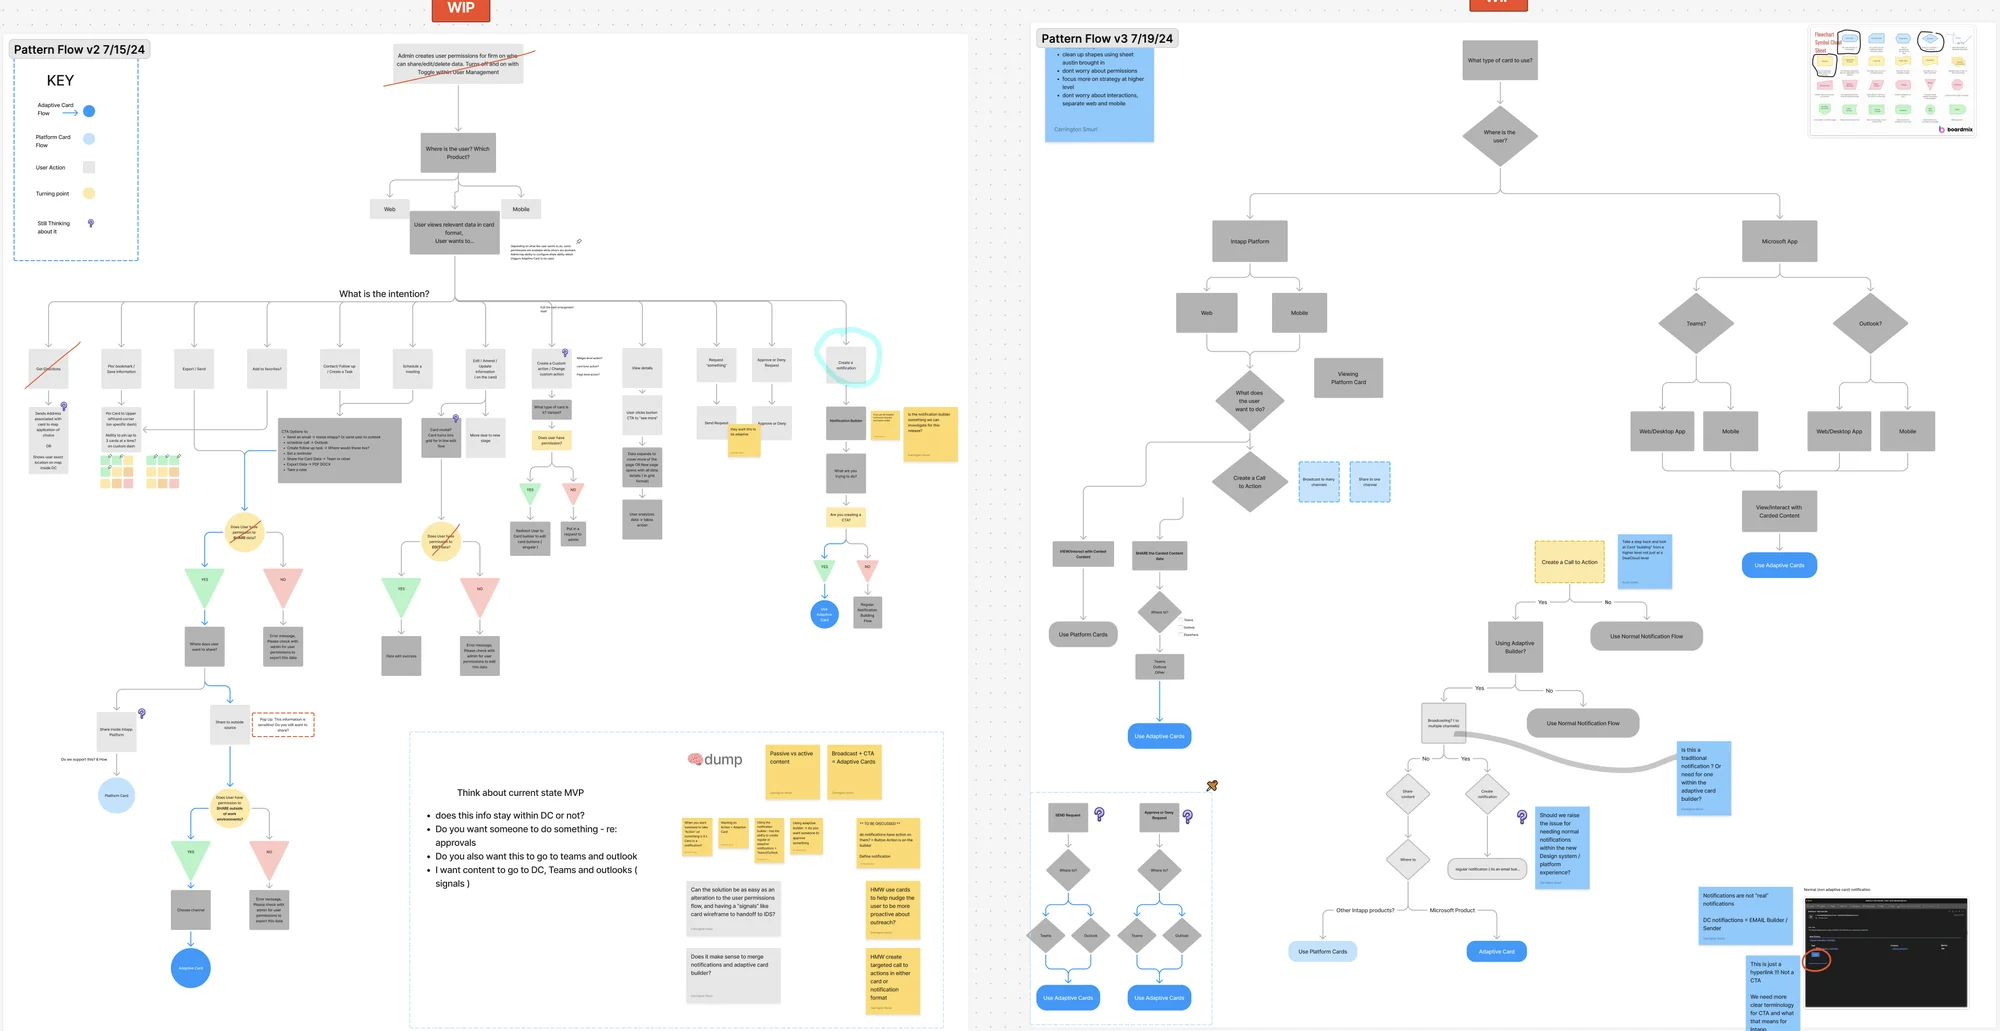
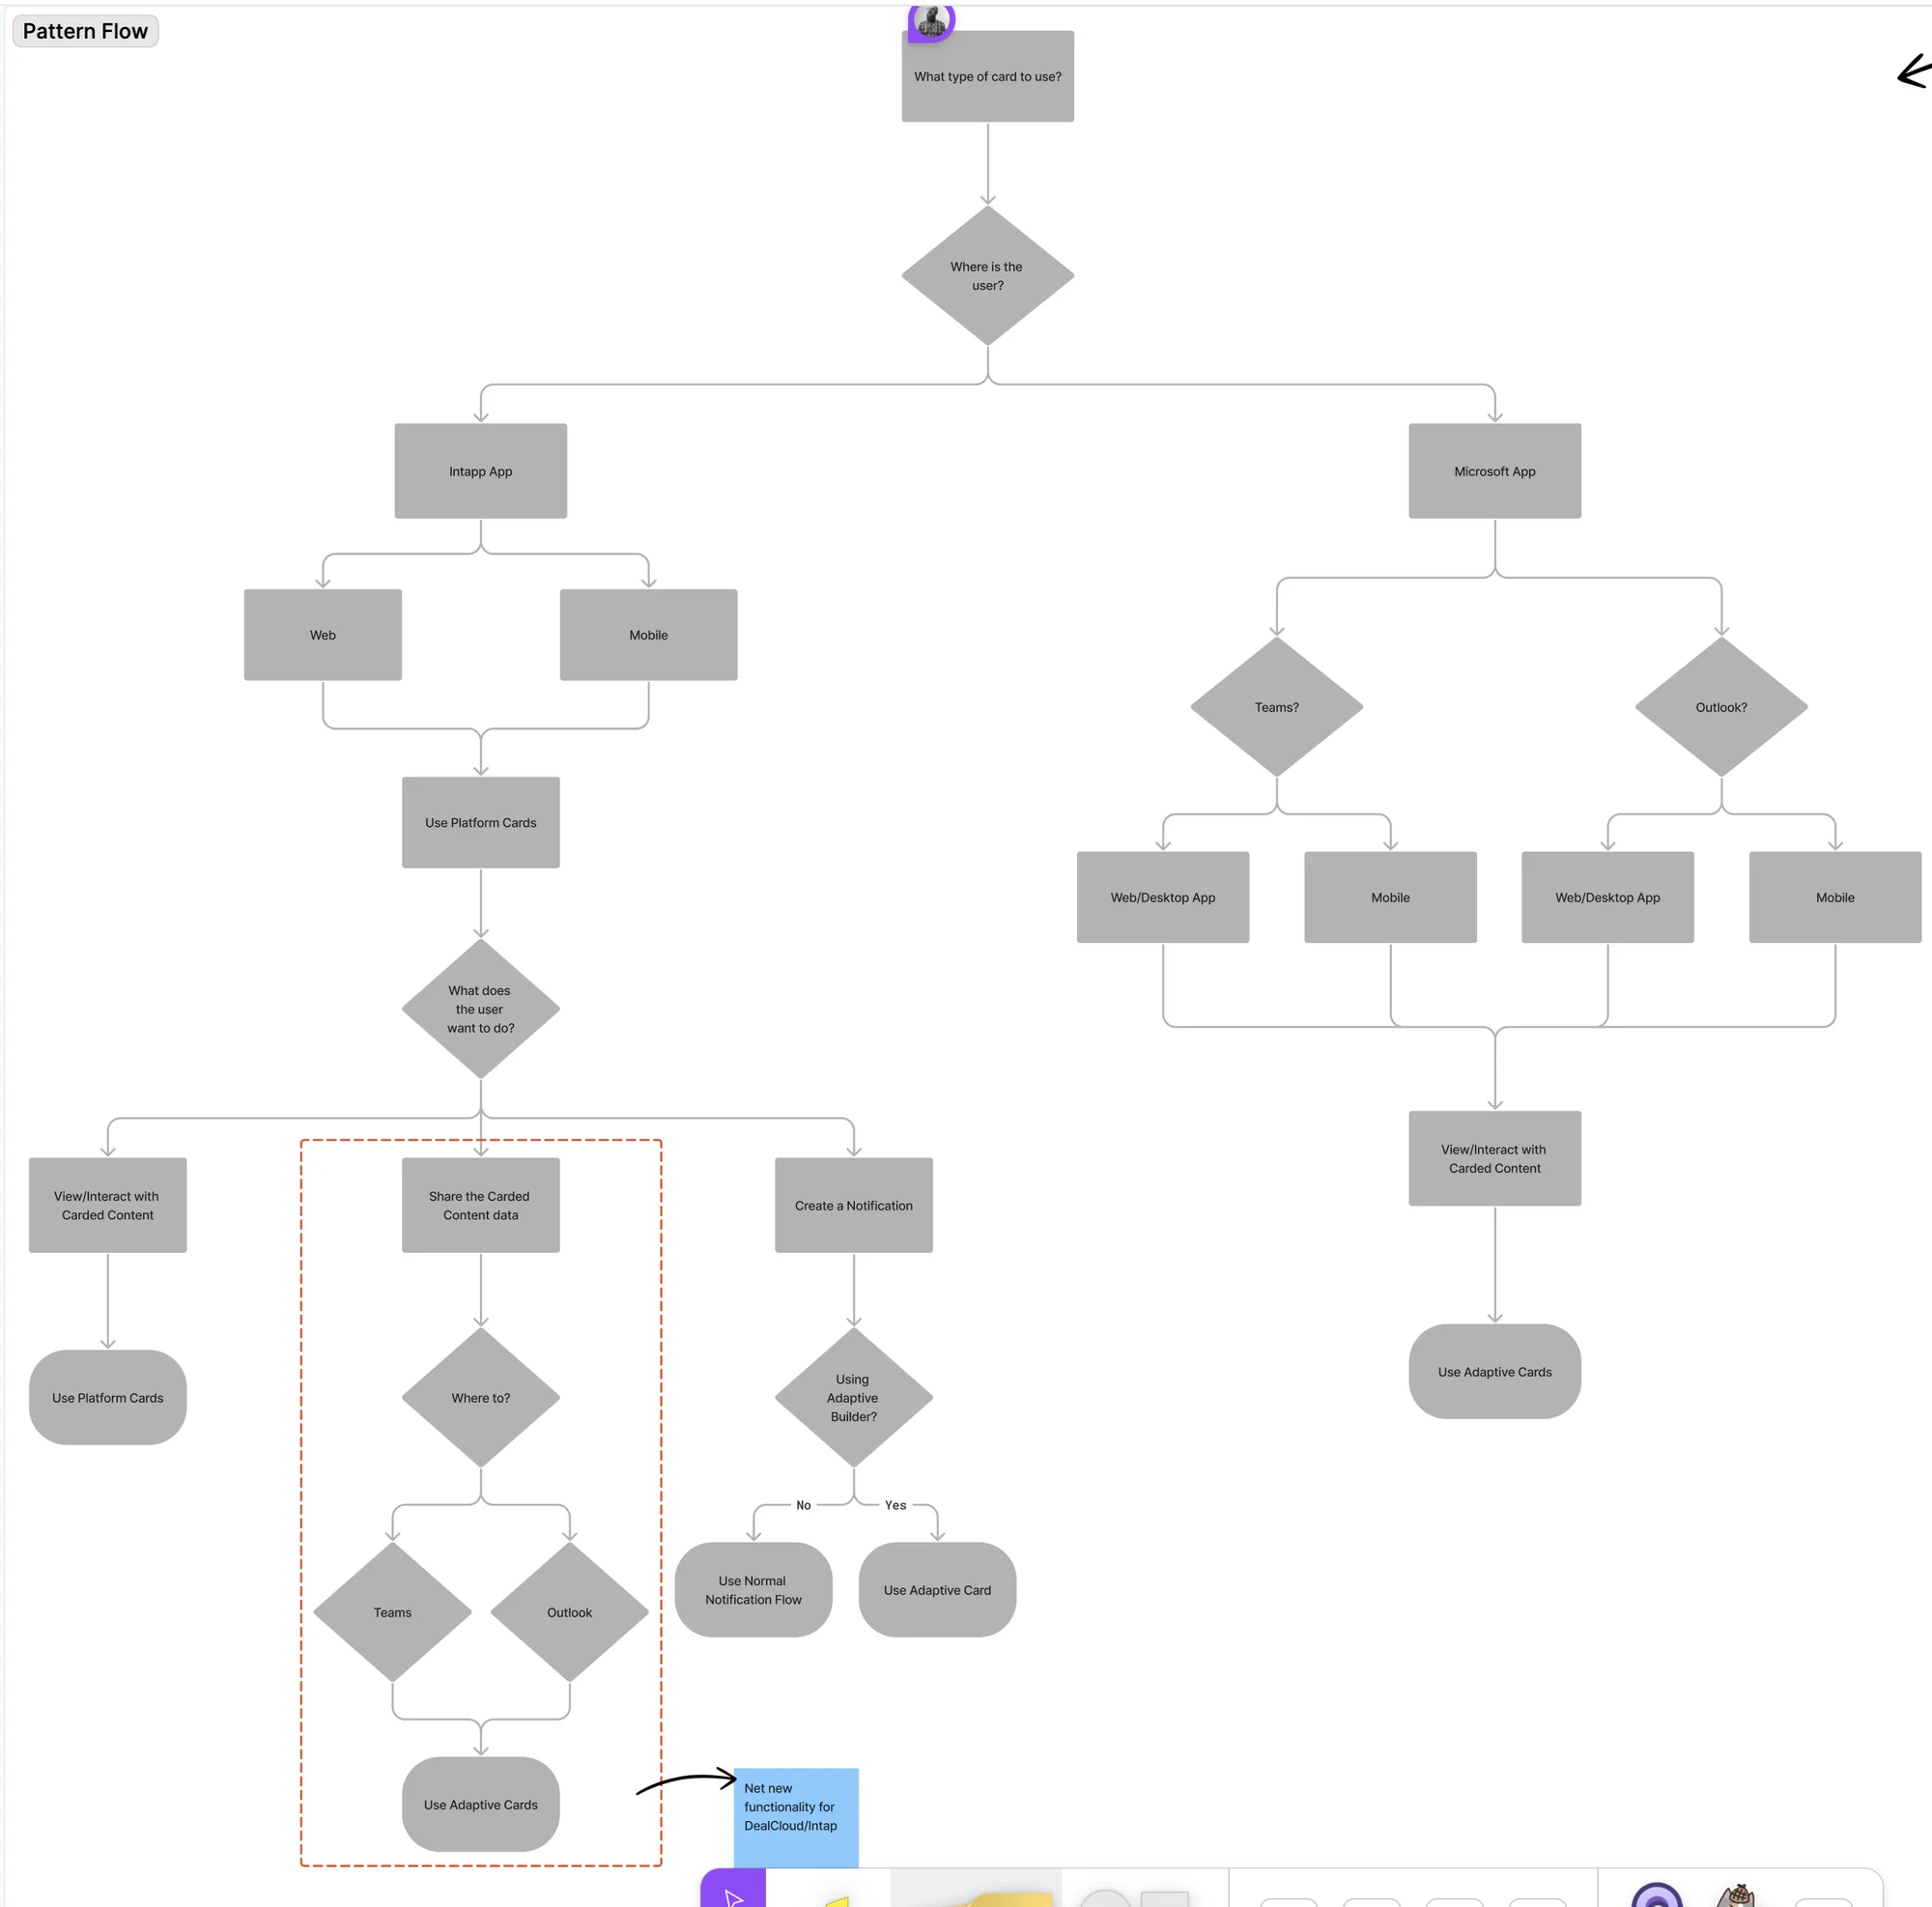
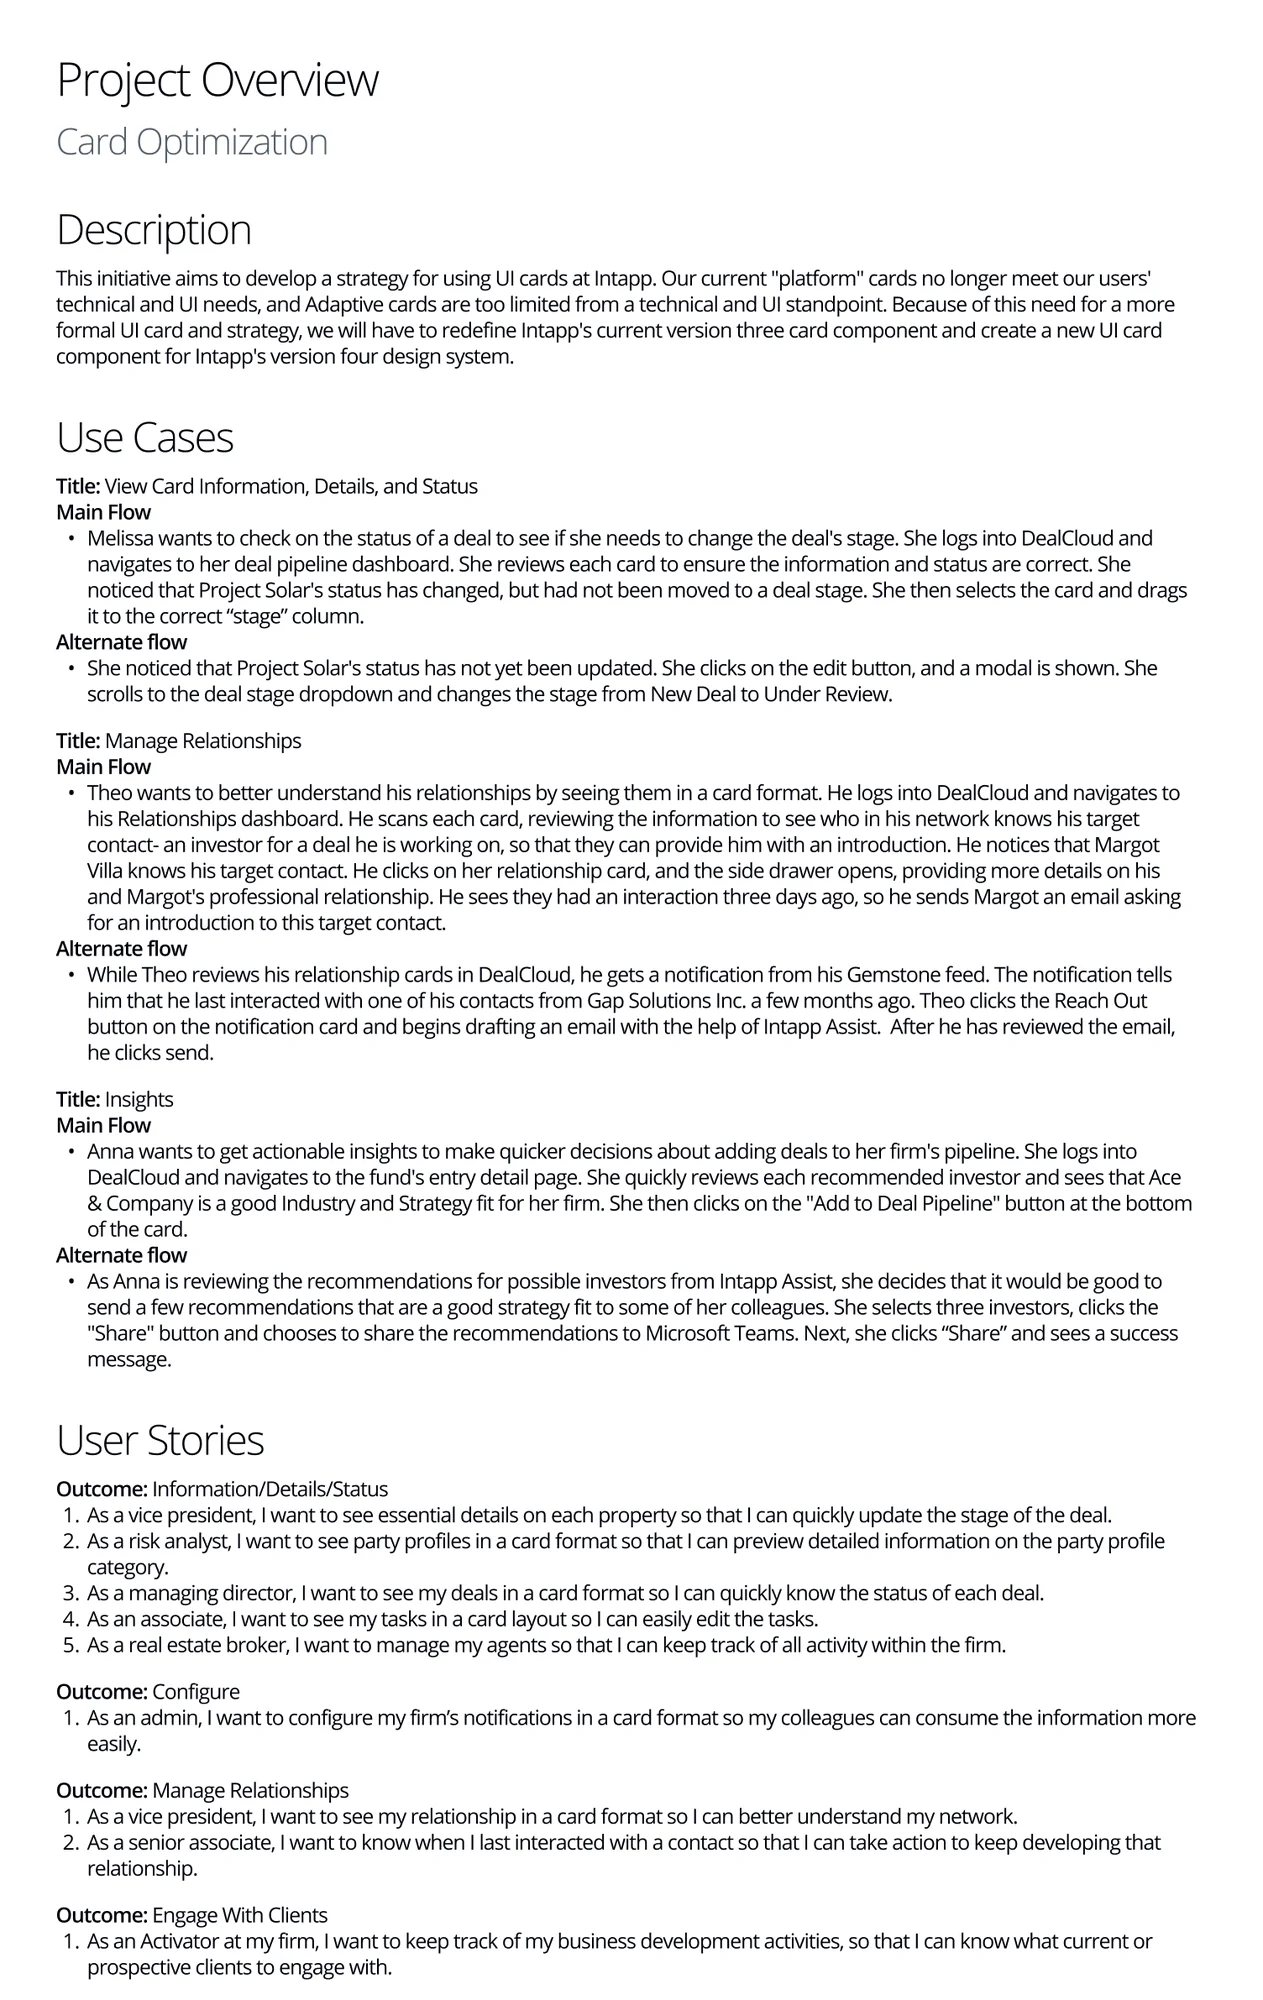
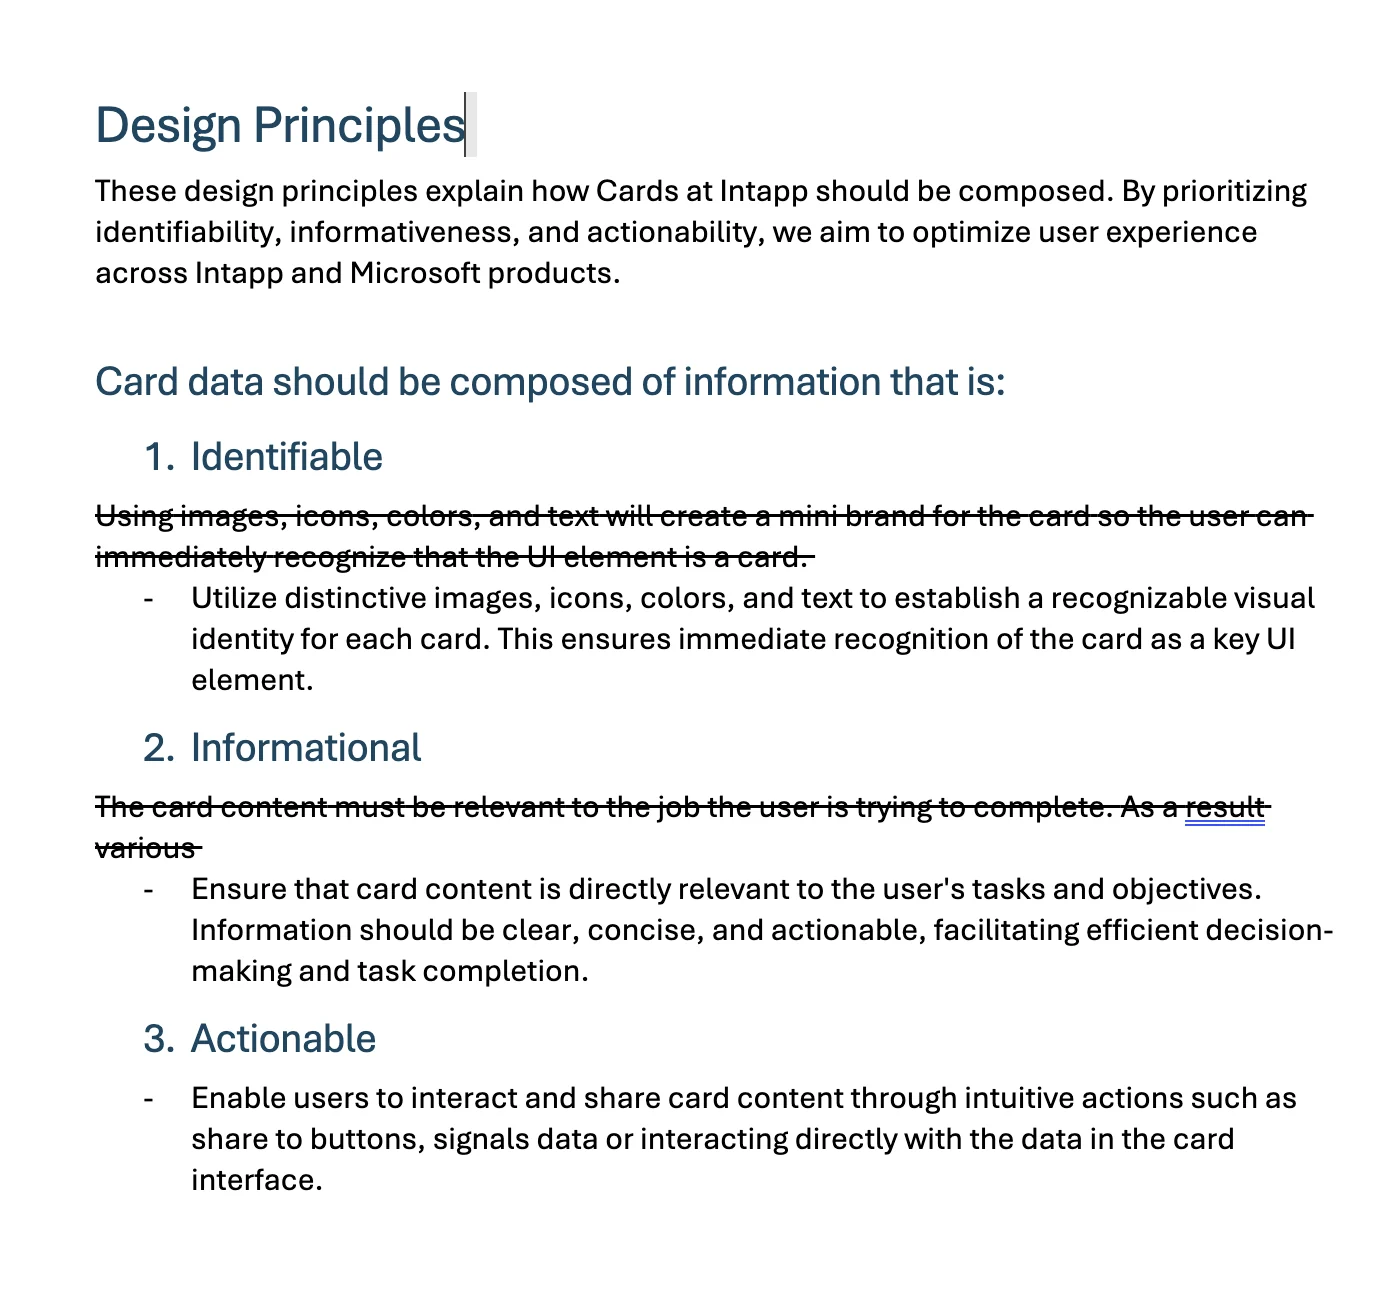
Full size ↗Pattern flow — when to use whichA decision tree for when to use a platform card and when to use an adaptive card. This is the artifact I would point at if asked what I actually shipped. A taxonomy tells people what the words mean; a decision tree tells them what to do on a Tuesday, which is the thing that stops the ambiguity coming back once everyone who made the decision has moved on.Full size ↗Documentation, off the FigJam boardGetting everything off FigJam. Before wireframing we laid out the ground rules for the Figma file for everyone who does not live in Figma like we do — description, use cases with main and alternate flows, user stories with outcomes. Research that only exists as sticky notes has a shelf life of about one reorg.Full size ↗Design principles, mid-editCard content should be identifiable, informational, and actionable. The strikethroughs are deliberately left in: these guidelines covered both the new and the renamed components and required Design Systems team approval, so I drafted them in collaboration with that team rather than handing over a finished document to be argued with.
Wireframing
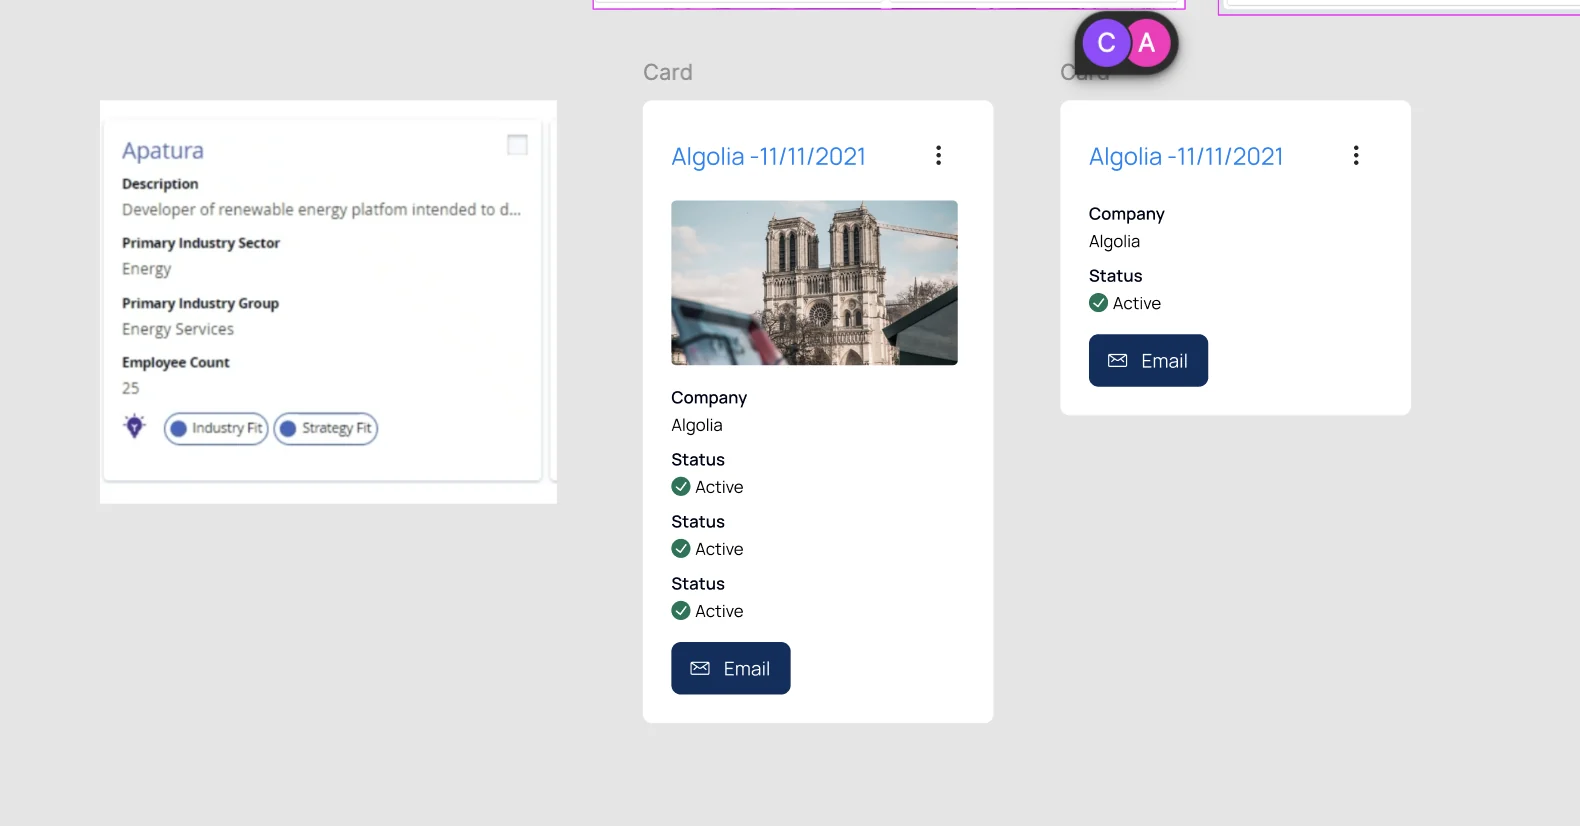
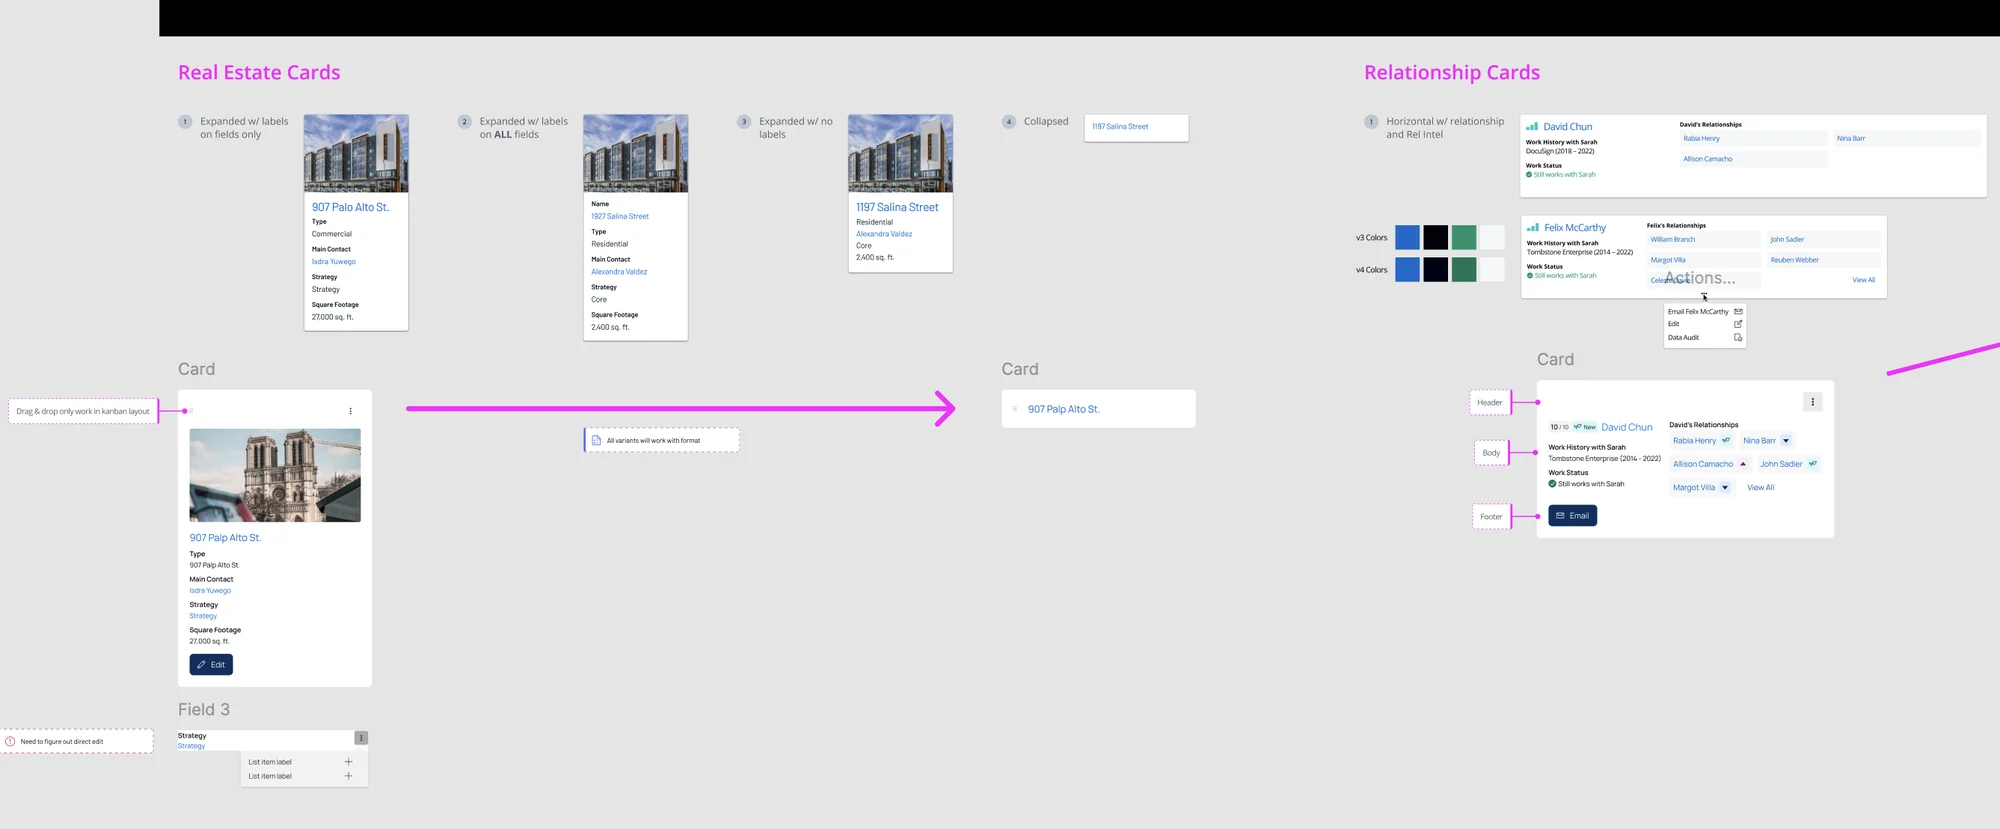
Full size ↗Before and after — the component itselfThe existing card on the left, the proposed replacements on the right. The change is not decoration: the old card is a read-only summary, and the new one ends in an action. That is the taxonomy made visible — a container holds information, a UI card does something.Full size ↗Variant matrix — WIP analysisEvery combination that has to exist: horizontal and vertical, with and without relationship data, with and without relationship intelligence, and collapsed. Each one labelled header, body, footer, so the anatomy stays constant while the content varies. This is what “technology-agnostic” actually costs — the pattern has to hold its shape through all of it.Full size ↗Final wireframesReal estate and relationship cards at four densities, from fully labelled to collapsed to a single line of text. Labels are the variable because they are what a scanning user does not need and a new user cannot do without — and the v3 and v4 colour swatches sit beside them as the reminder that this all has to land inside an existing system.
Handing off
In August the work was handed to the Design Systems team to finalise the visual layer.
The outcome was still in progress when I handed off, and I am not going to claim a result I
did not see. What shipped out of my half: a taxonomy the organisation agreed on, the
competitive analysis behind it, a quantitative baseline, three validated use cases with flows,
a pattern flow, rewritten guidelines approved by the team that owns the system, and a variant
matrix specified down to anatomy.
What I would tell you in an interview
The lesson I took is that design system work is frequently language work. The ask was a
component redesign. The actual blocker was a word carrying two meanings, and no component
would have resolved it.
The second lesson is about what survives you. Of everything on this page, the artifact with
the longest life is the pattern flow — the decision tree that answers “which one do I use
here?” without anyone having to find me. Research boards get archived. Wireframes get
redrawn. A rule people can follow is the part that stays.
What I would do differently: I would have pushed for a usage metric before handoff. I have the
qualitative case for the split and the stakeholder agreement, but no measurement of whether
the new taxonomy reduced the confusion it was meant to reduce — and without that, the next
person to question the rename has nothing to check it against.