Lawyers lose billable hours because recording them is tedious. The design problem was not a prettier dashboard — it was understanding why a profession this well paid tolerates a workflow this bad.
Role
Associate UX Designer
Timeline
6 months · 2023
Client
Intapp
Team
With Senior Designers; collaborated with technical writers and legal SMEs
Surfaces
Time-capture dashboard
Stack
Figma · FigJam
Constraints
Legacy product with an aged technology base
Three distinct user types with incompatible daily rhythms
Needed executive buy-in to become a funded annual initiative
The problem
Intapp Time exists so that partners and professionals can record and submit complete accounts
of the time they spend on each engagement. When it works, firms recover revenue that would
otherwise evaporate as missed and under-recorded effort. When it does not, people reconstruct
their week from memory on a Friday afternoon and the firm eats the difference.
We were asked to build a proof of concept dashboard for the legacy time-capture product.
Two questions framed it:
How might we capture a legal professional’s time automatically?
How might we help them keep up with their clients more efficiently?
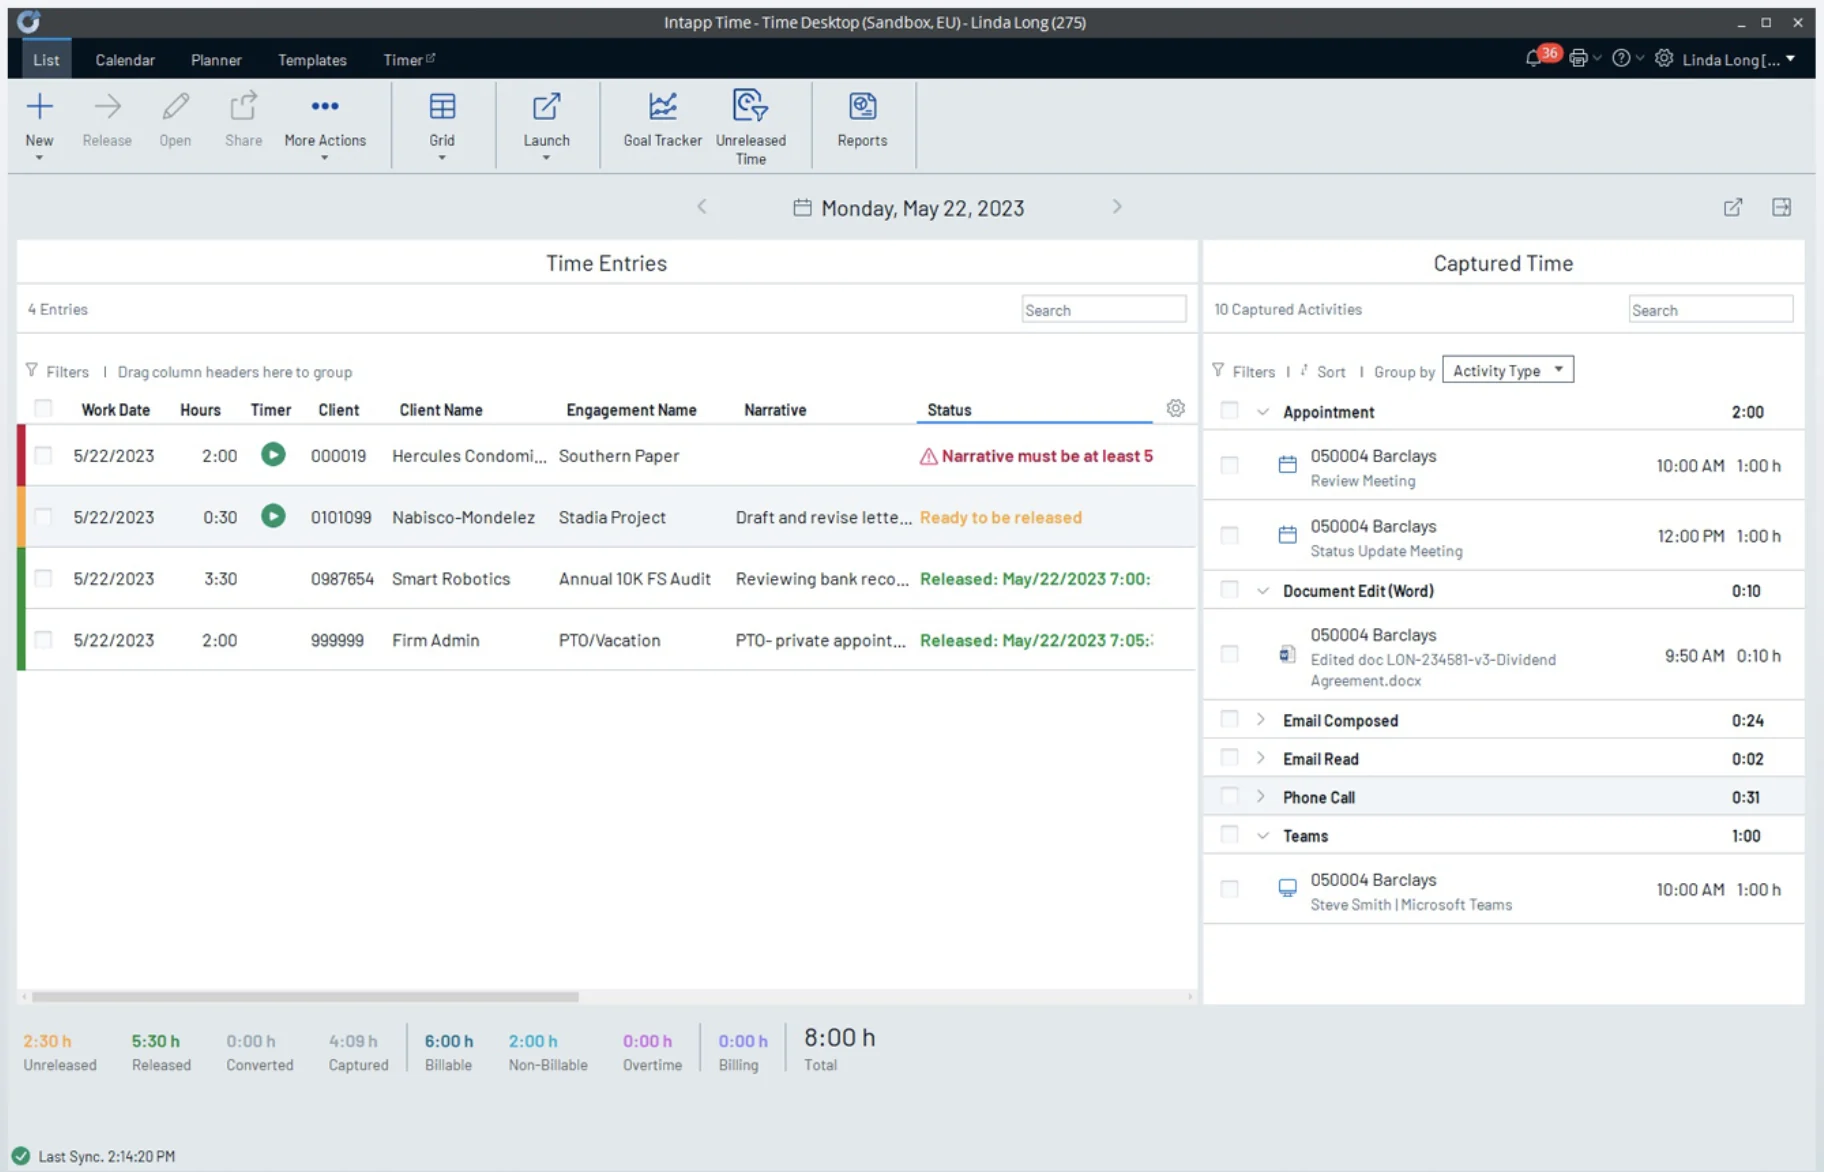
Full size ↗Before — the legacy desktop productTwo grids and a status bar. The right-hand panel already knows the user spent 1:00 on a Barclays review meeting and 0:02 reading an email — the machine has the data. The left-hand panel still asks them to type it in. The whole proof of concept lives in the gap between those two columns.
The objectives were not only design ones. Alongside understanding daily capture needs and
upgrading a dated visual layer, we had to work out what metrics the dashboard was not
showing, create a central documentation repository for brand, content, developer guidelines
and component usage rules — and get buy-in from product leaders to fund this as an annual
initiative.
That last objective shaped everything. A proof of concept that does not persuade an executive
is a portfolio piece, not a product.
Discover: what does a lawyer actually do?
I did not know what a lawyer does hour to hour, and designing time capture without that is
guesswork. So the first board was not a wireframe.
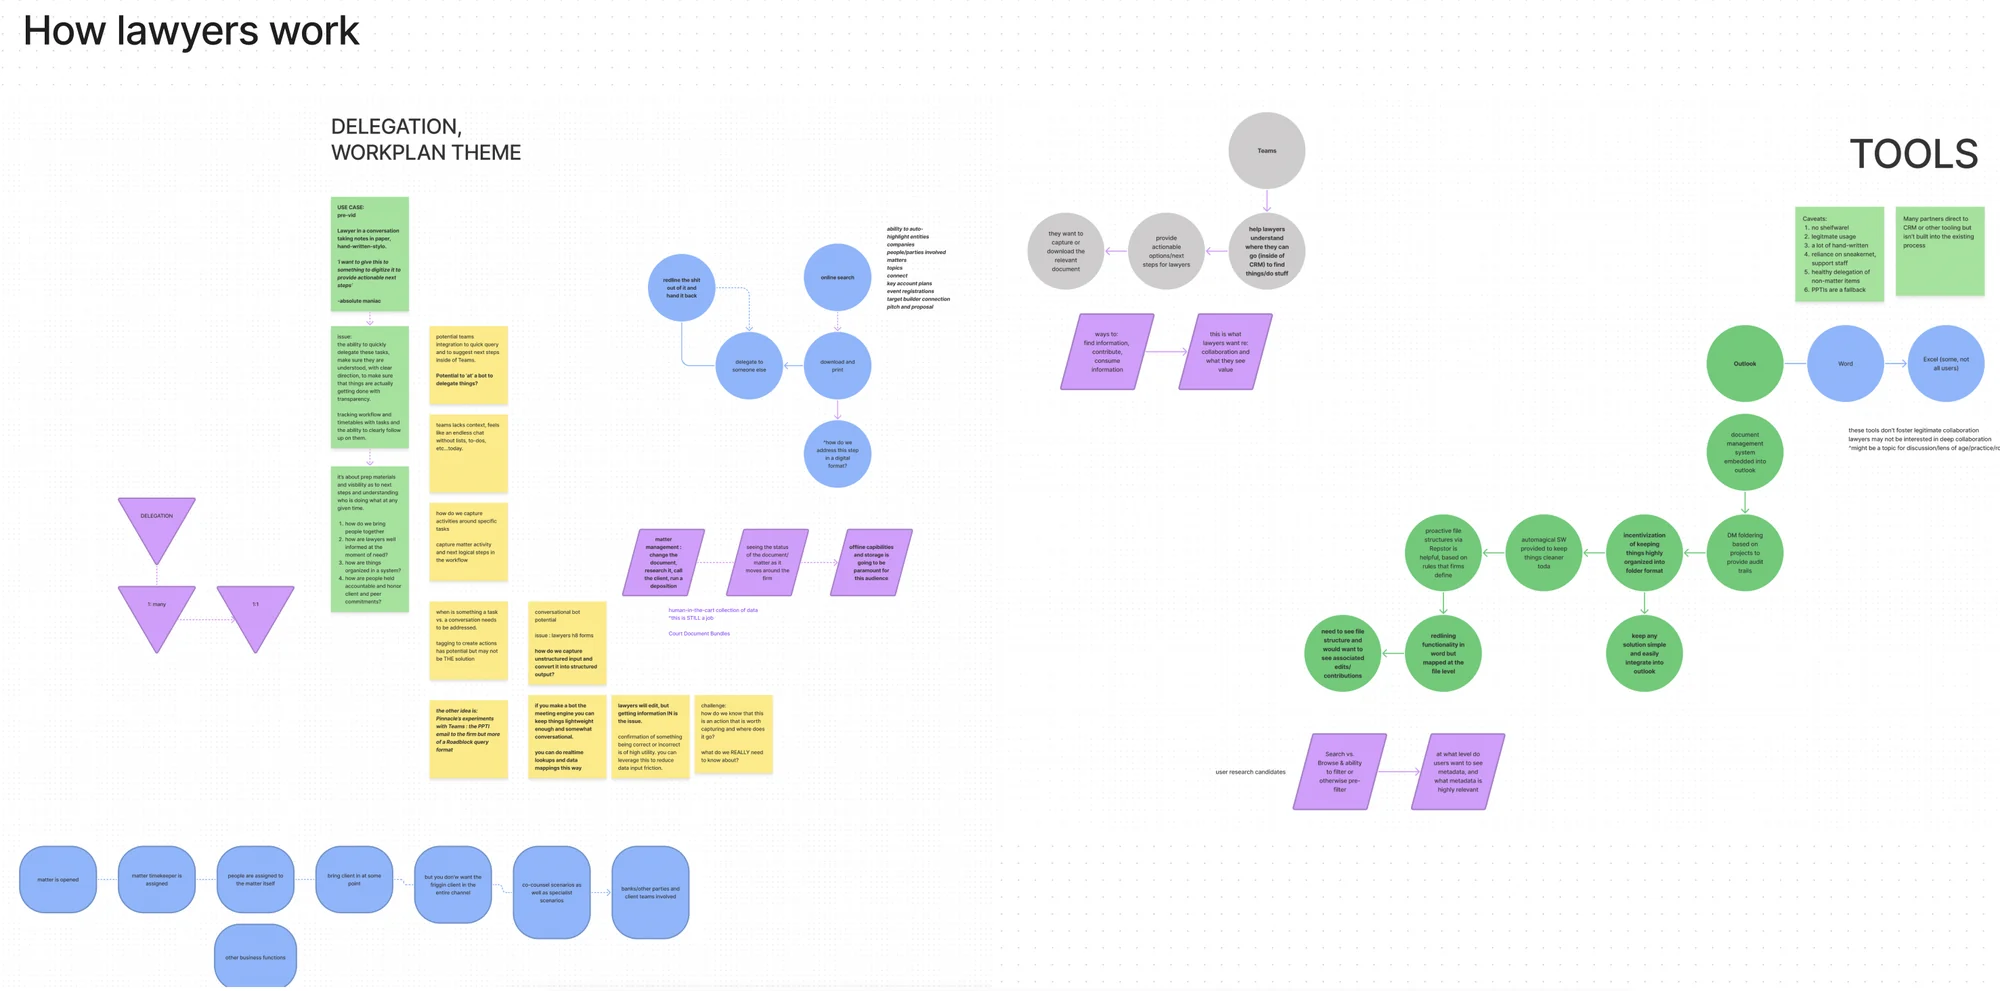
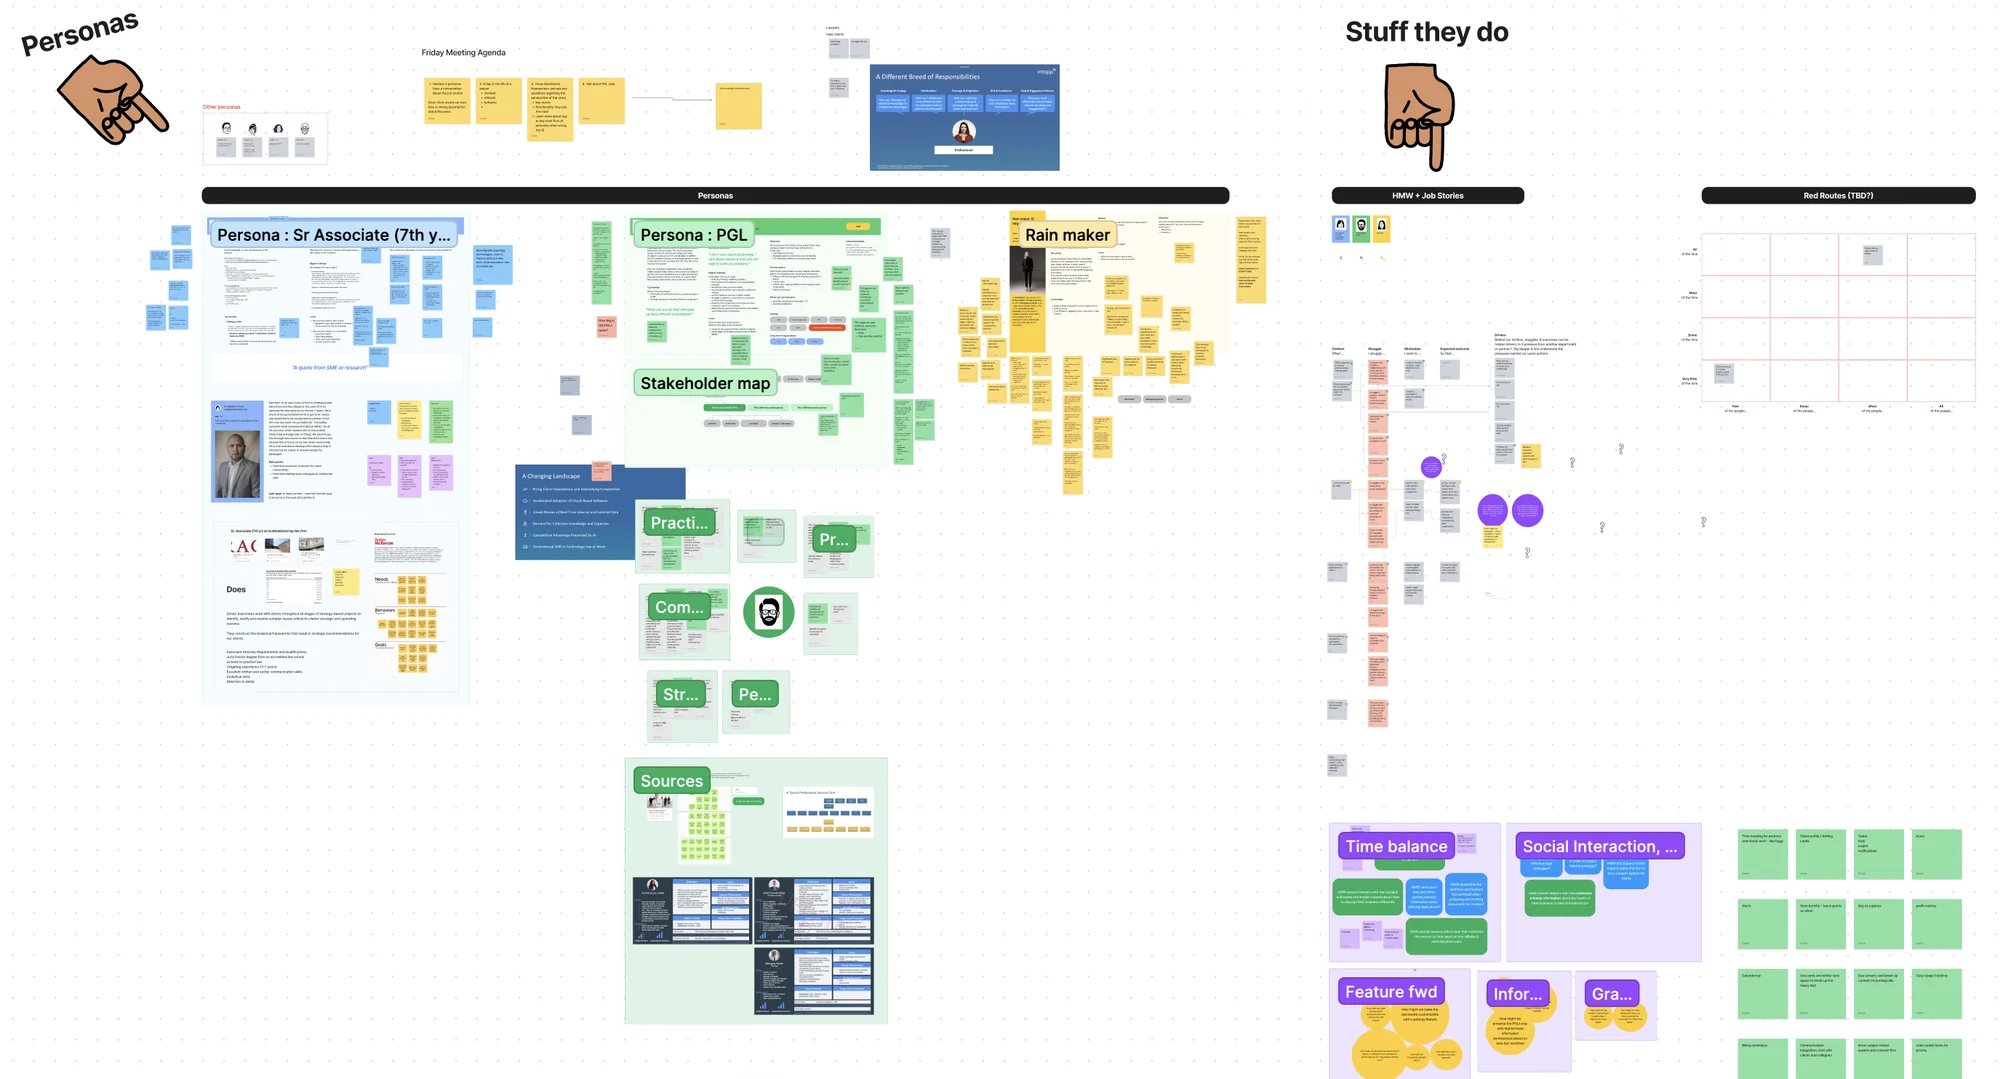
Full size ↗How lawyers workWhat does a lawyer do, how do they work, and why do they operate this way — mapped from delegation and workplan patterns on the left through to the tools they actually touch on the right. Learning how legal professionals keep a book of business aligned had to come before any opinion about a dashboard.Full size ↗Persona development in progressMultiple rounds of conversation and persona planning, drawing on prior research and internal subject-matter experts to validate assumptions rather than inventing a user. In enterprise work the expertise usually already exists inside the company — the job is finding it and checking yourself against it, not restarting discovery from zero.
Three archetypes came out of several calls with subject-matter experts in legal firms, and
they do not want the same dashboard.
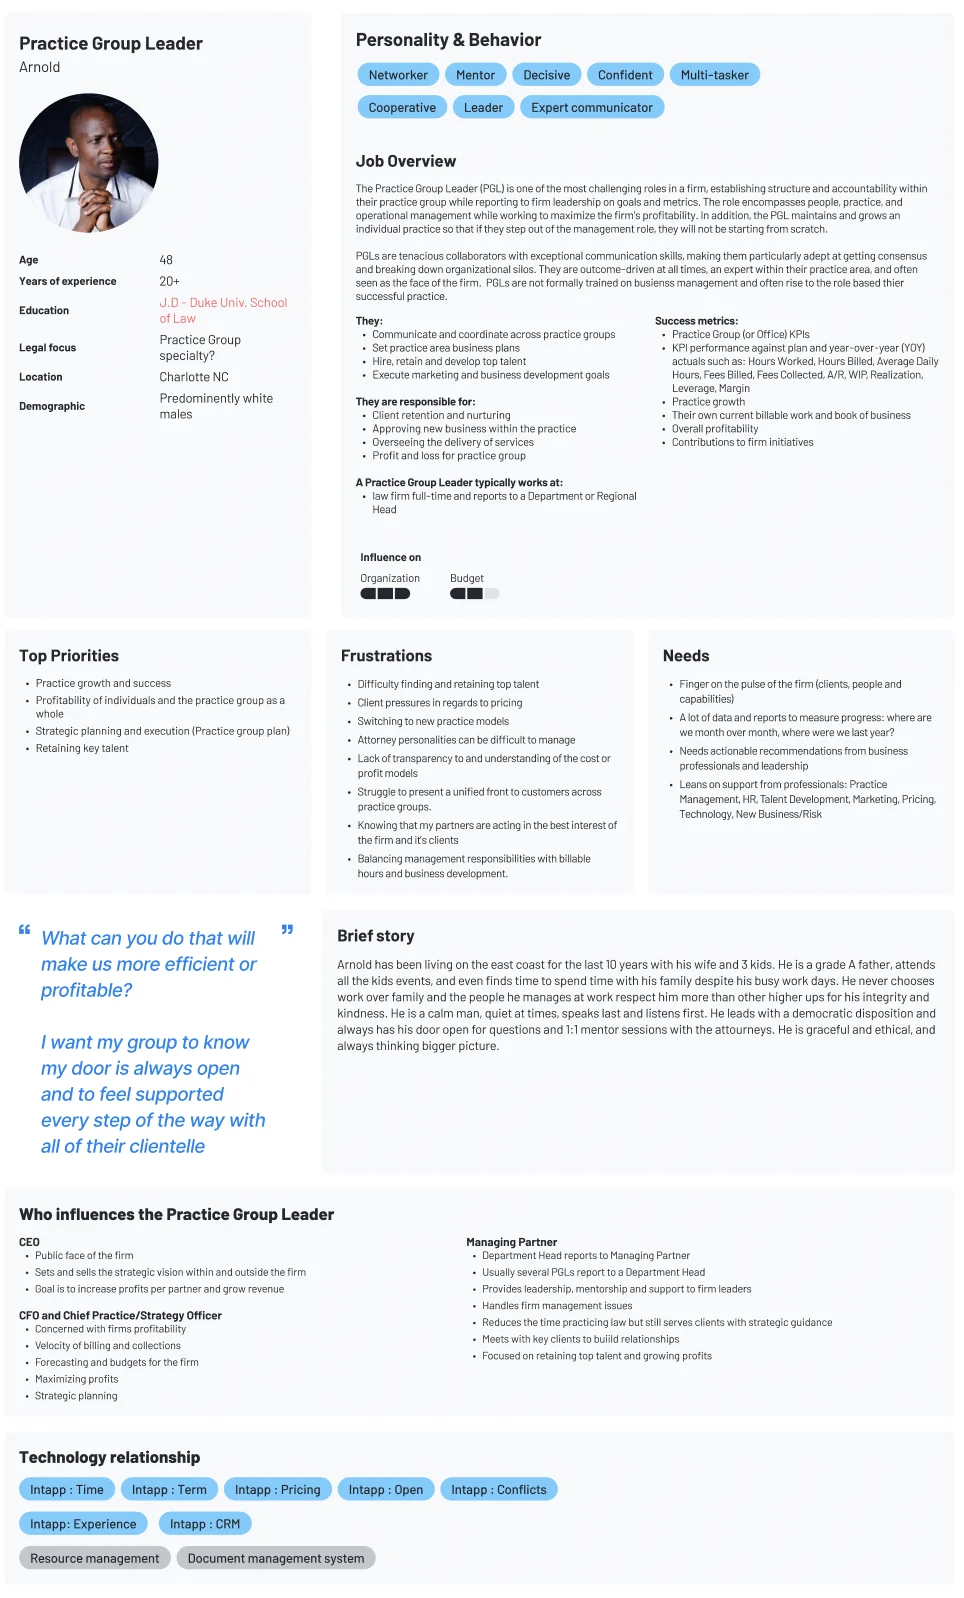
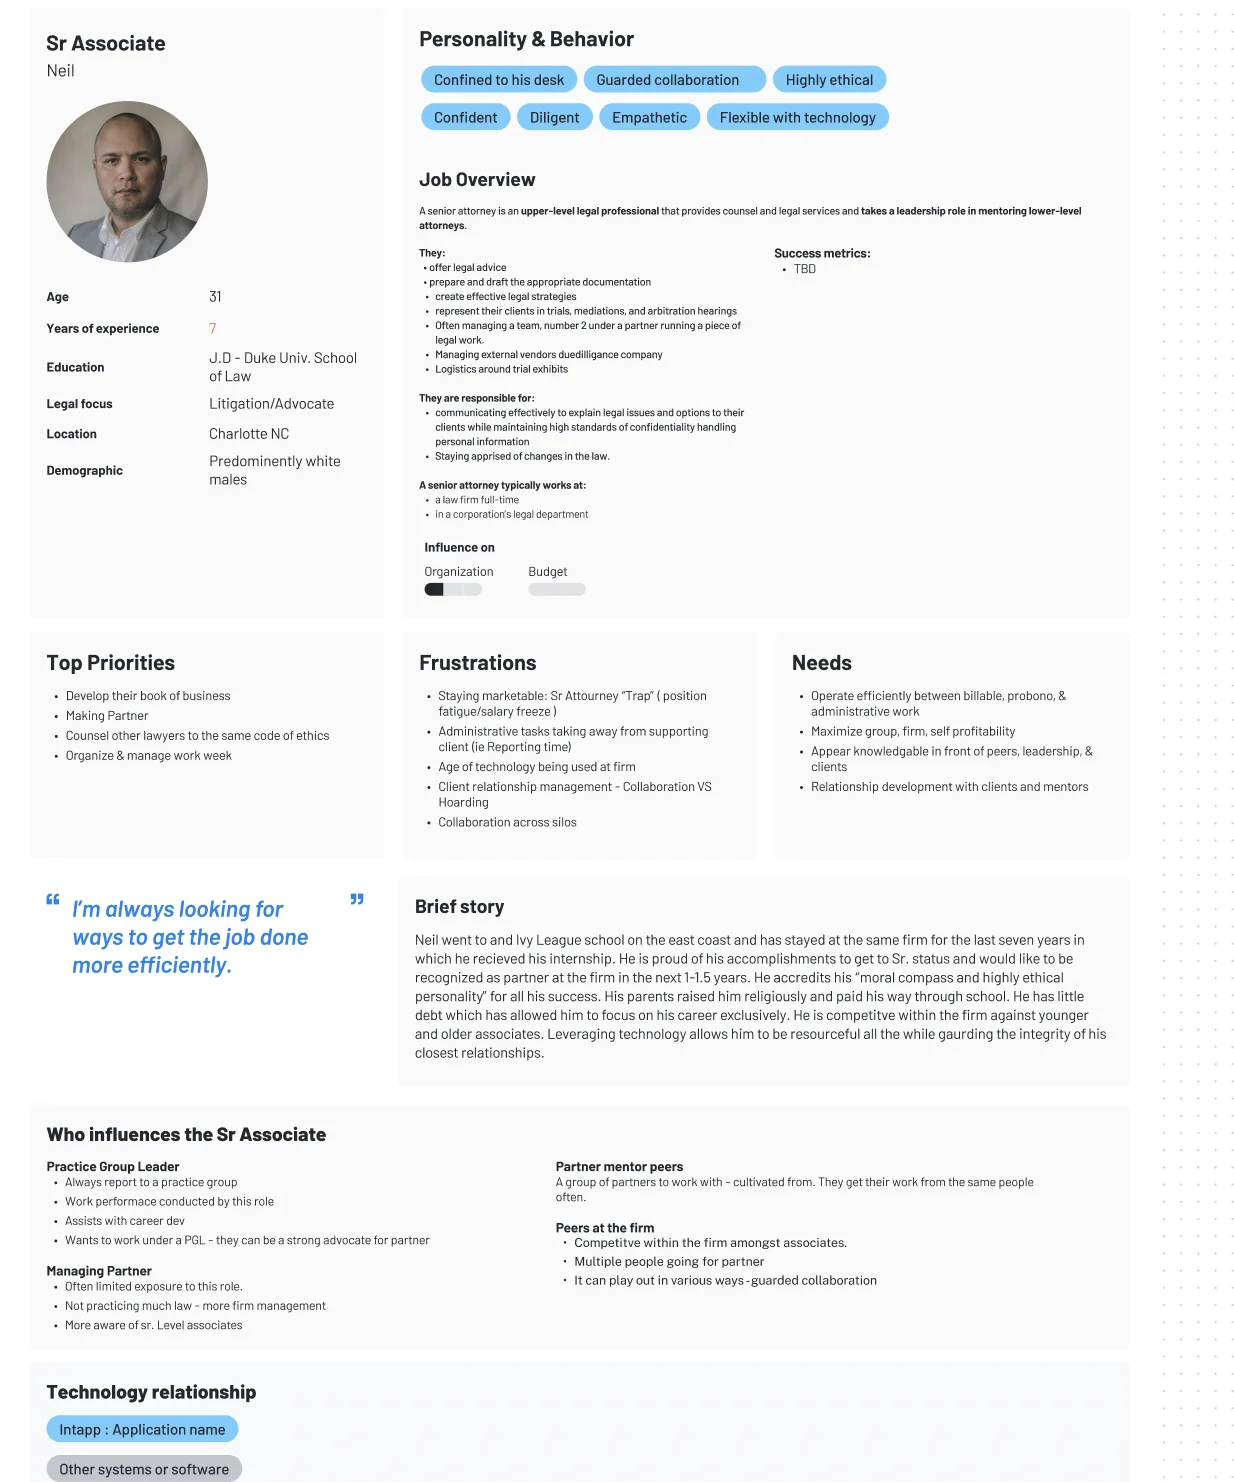
Full size ↗Persona — Practice Group LeaderArnold's priorities are practice growth, profitability of the group as a whole, strategic planning, and retaining key talent. His frustrations are management ones — difficulty retaining top talent, client pressure on pricing, a lack of transparency into cost and profit models. His quoted question is the brief for the entire dashboard: “What can you do that will make us more efficient or profitable?”Full size ↗Persona — Senior AssociateNeil's priorities are developing his own book of business, making partner, and organising and managing his work week. His quote — “I'm always looking for ways to get the job done more efficiently” — is the same sentiment as Arnold's from one level down, and it points at a completely different screen. Arnold wants the group's position; Neil wants his own week.
The useful distinction turned out not to be demographic but temporal: whether someone
records time as it happens or reconstructs it afterwards. A Practice Group Leader needs the
firm’s position, not their own hours. A Senior Associate is the heaviest individual capturer
and lives in the daily view. A Paralegal captures against other people’s matters, often
retroactively.
That split decides what belongs on a default dashboard and what can live one level down.
Sketch first
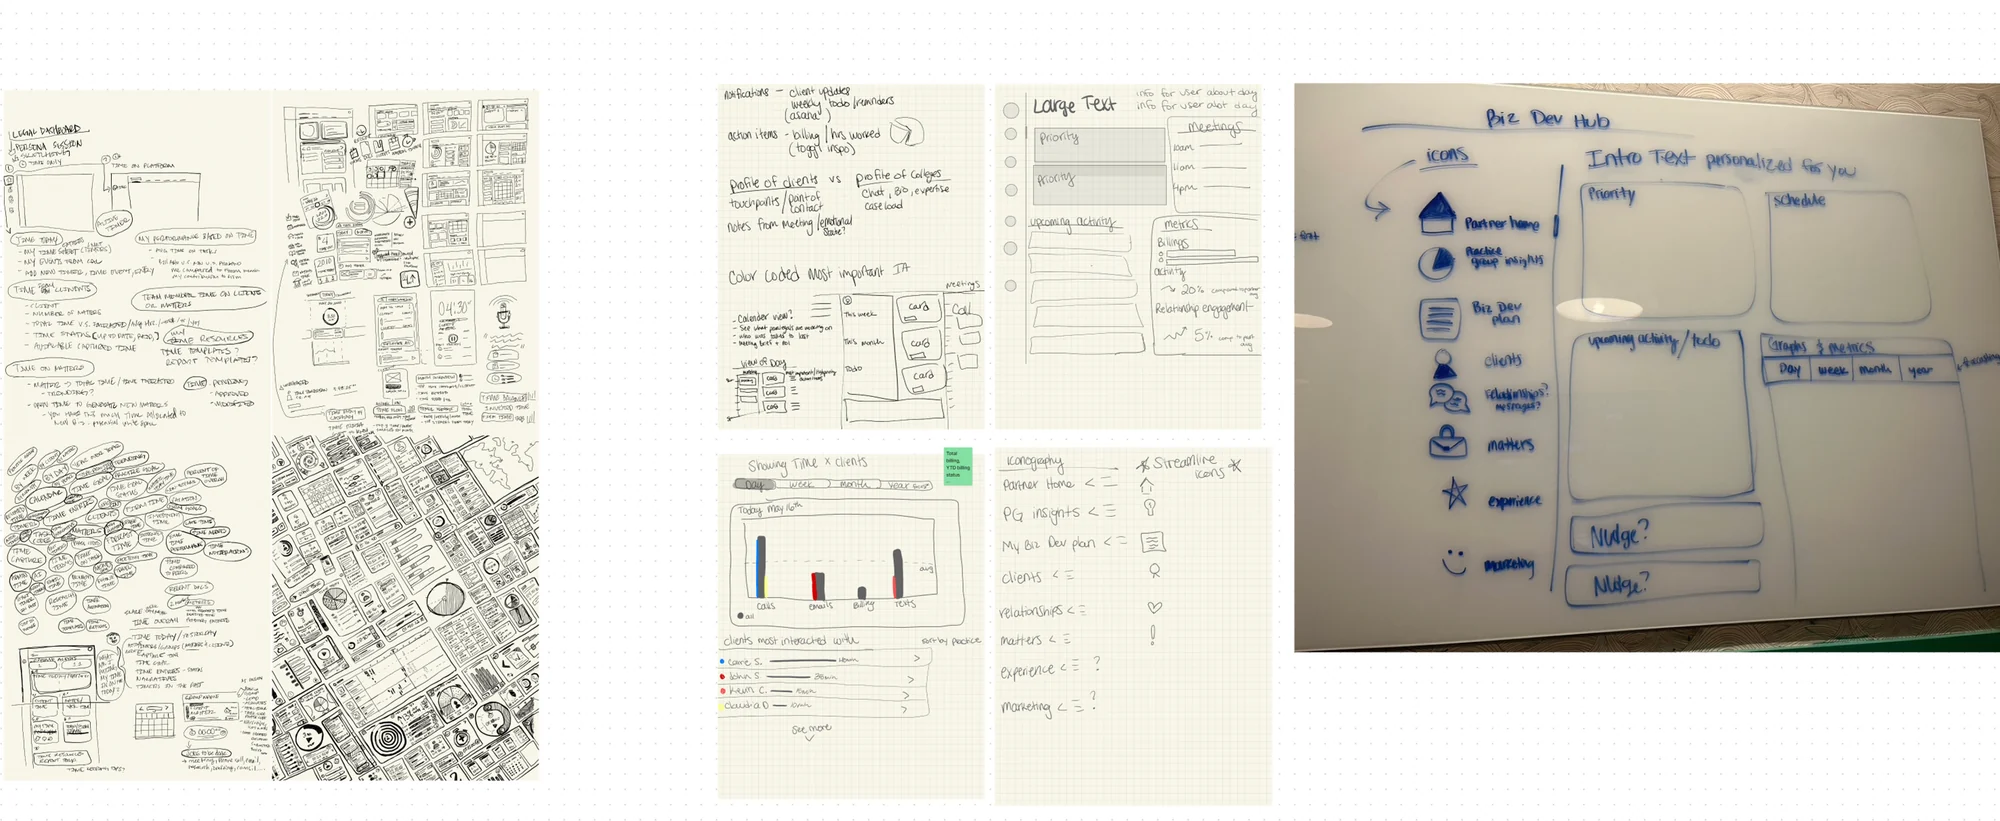
Full size ↗Content framework sketchingIndividual sketching and in-person planning, on paper and on the wall before anything opened in Figma. Sketching is where you find out whether a dashboard has one story or five competing ones, and it is enormously cheaper to find that out here than in a prototype.Full size ↗Information architectureWe met with the technical writers to settle content strategy and get what we needed from them before fixing layout. On a data-dense dashboard the words are the design — a metric nobody can name is not a metric, and the people who name things for a living should be in the room before the boxes are drawn.
Iterate
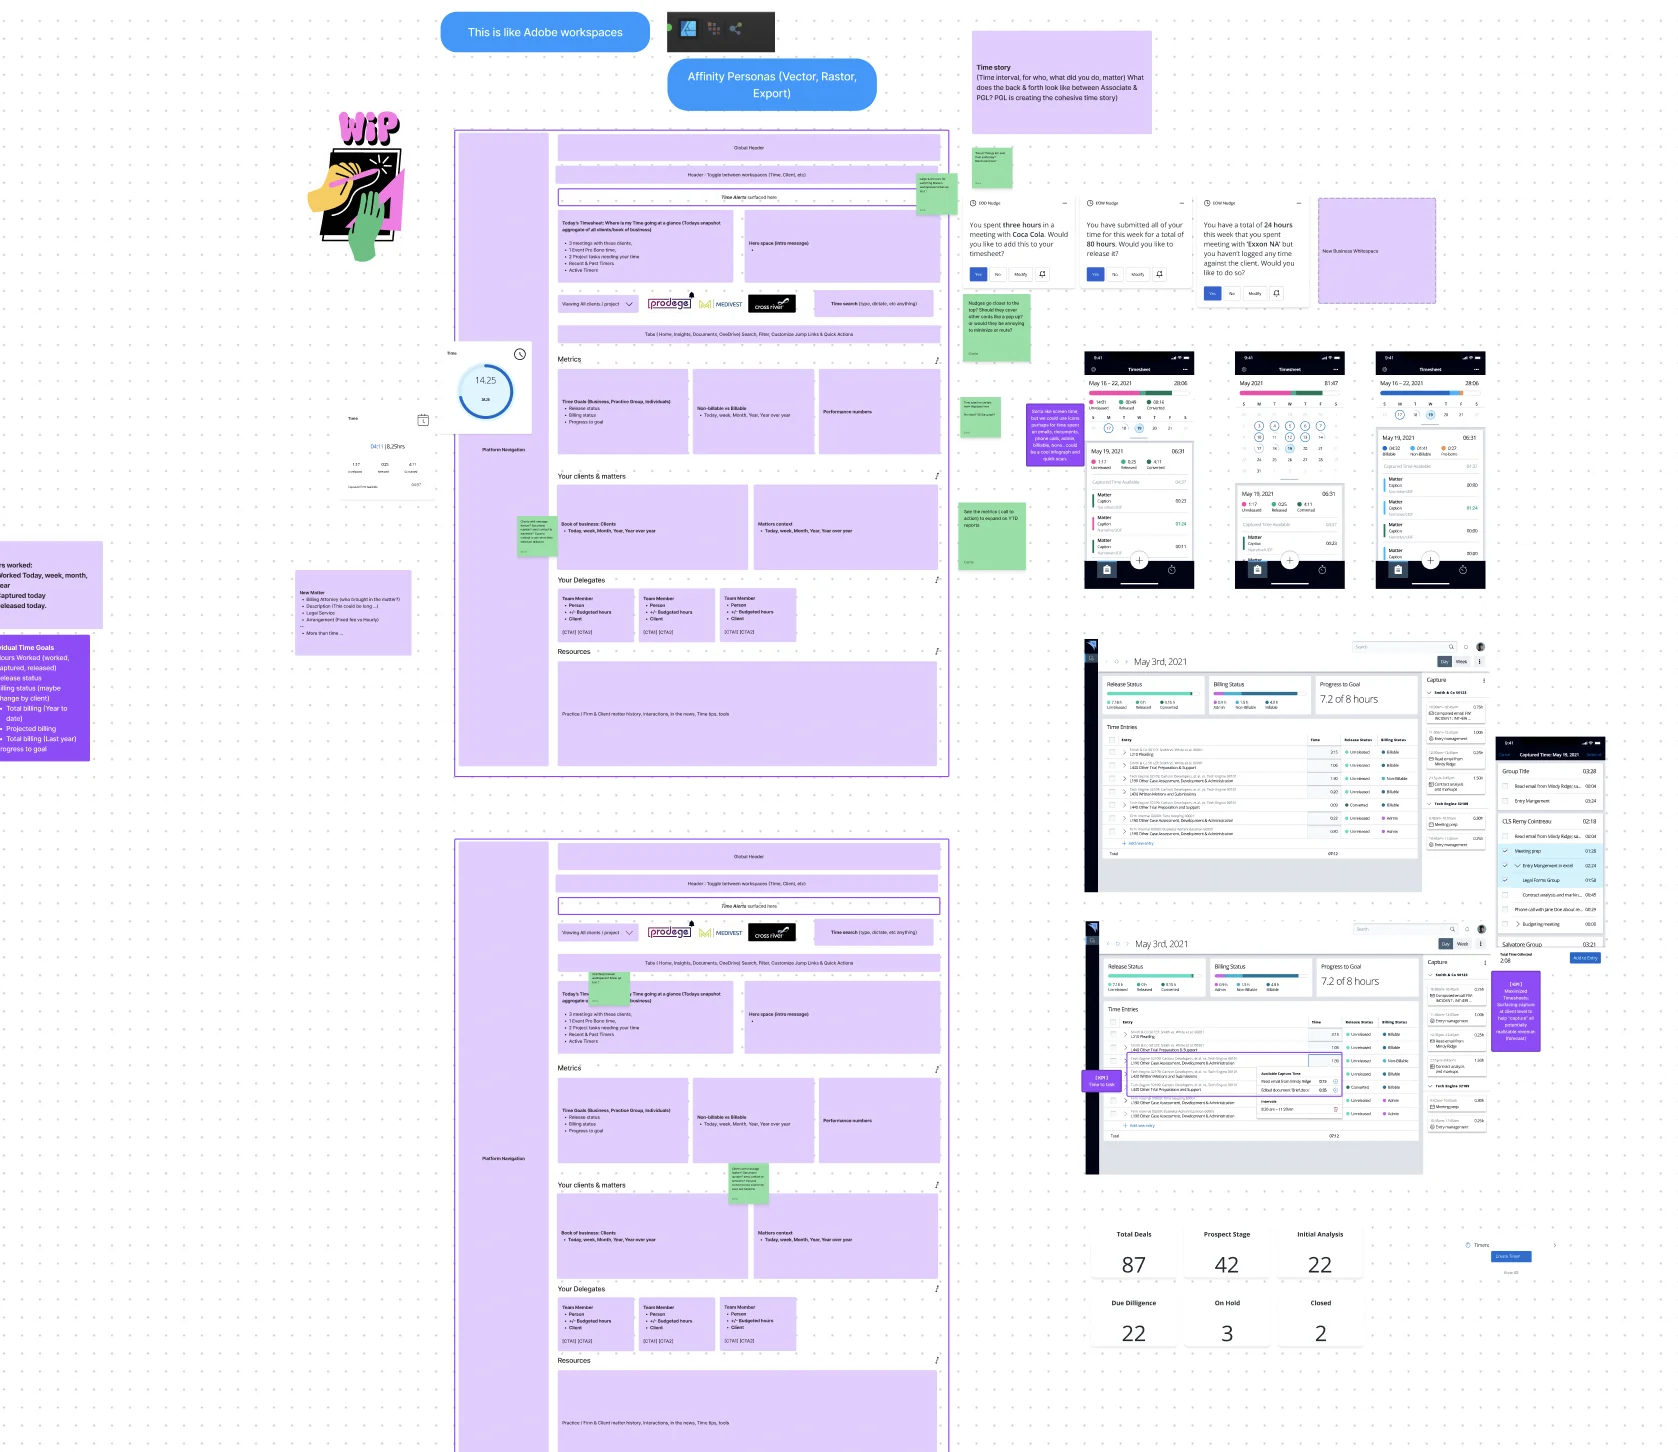
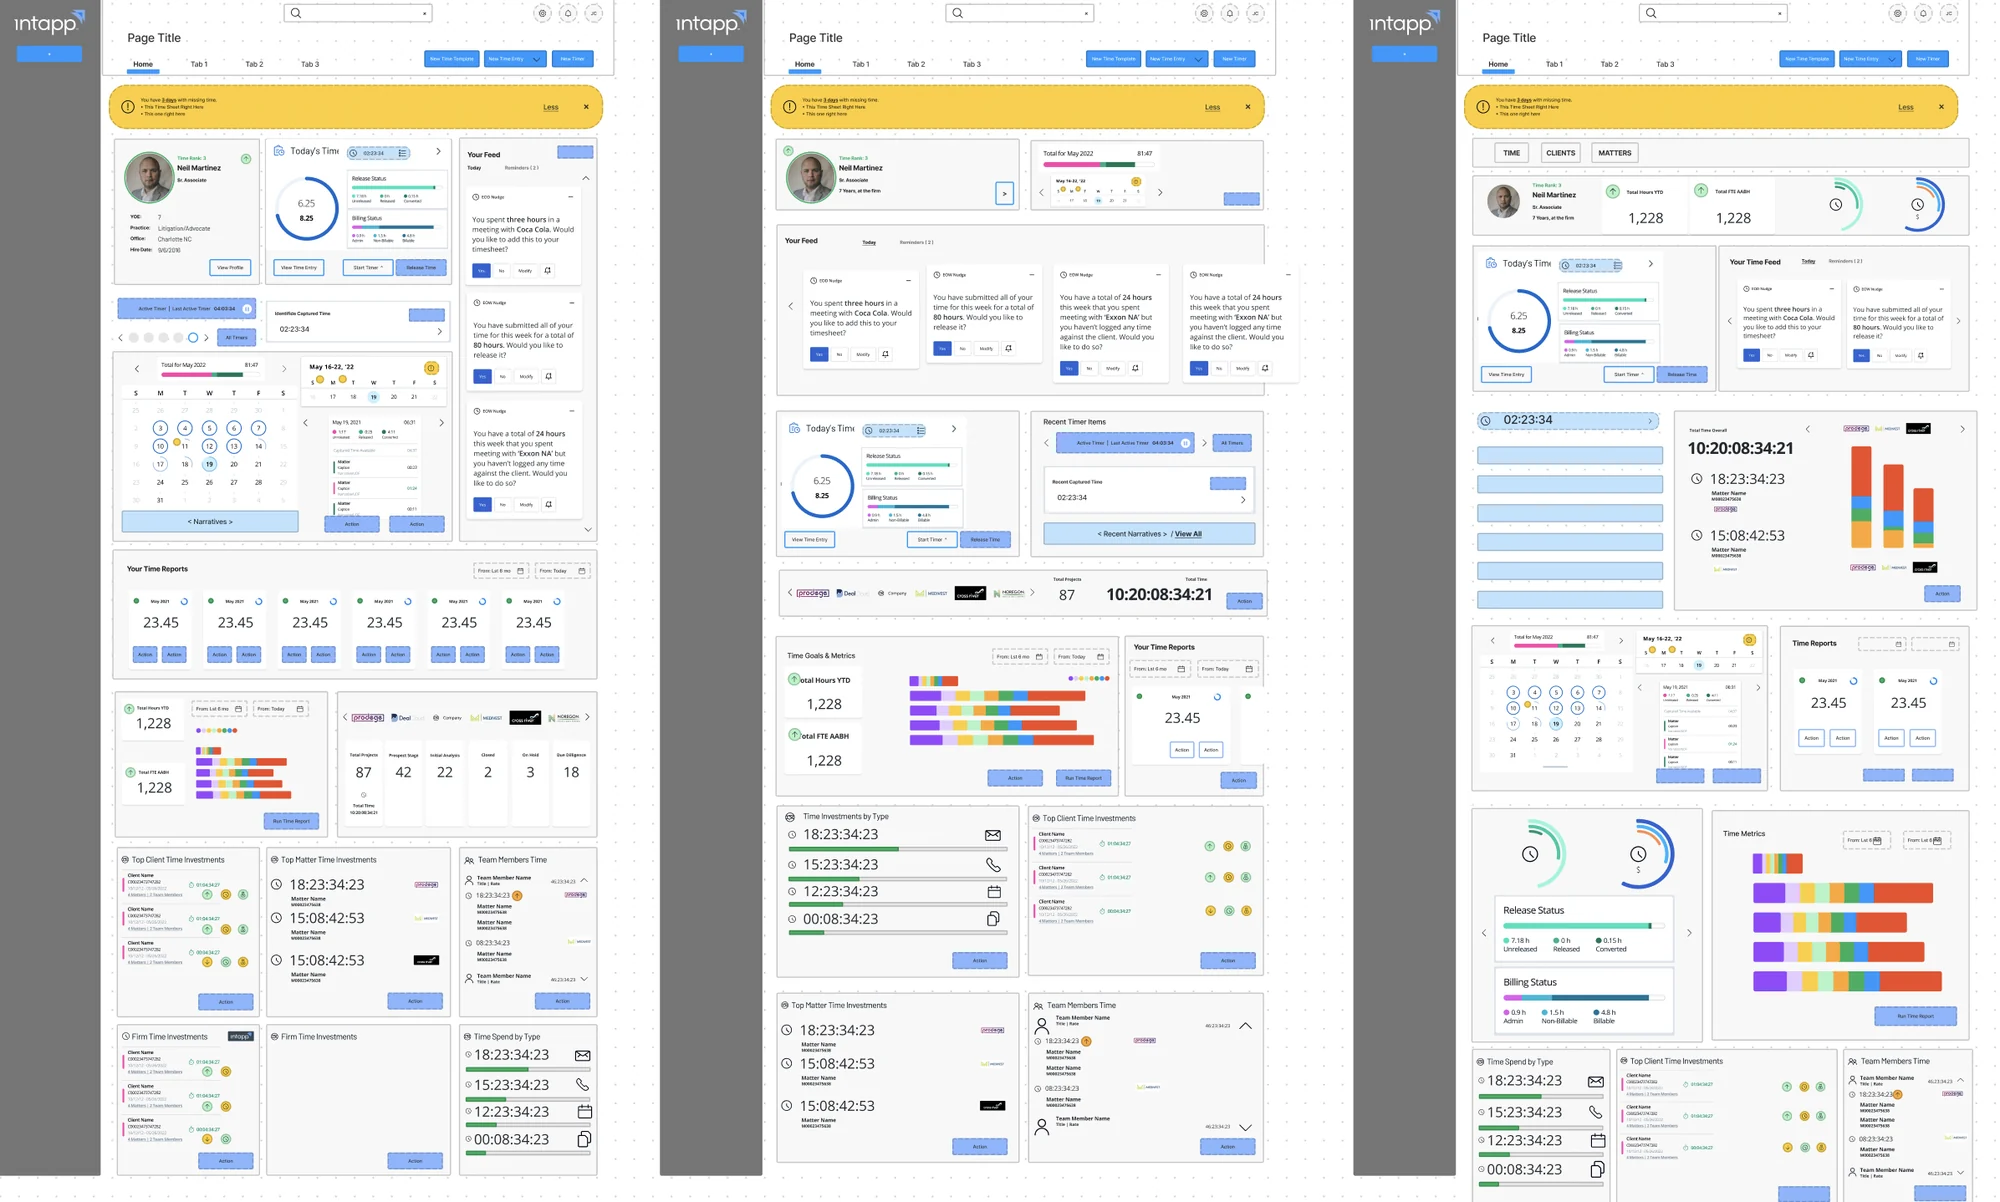
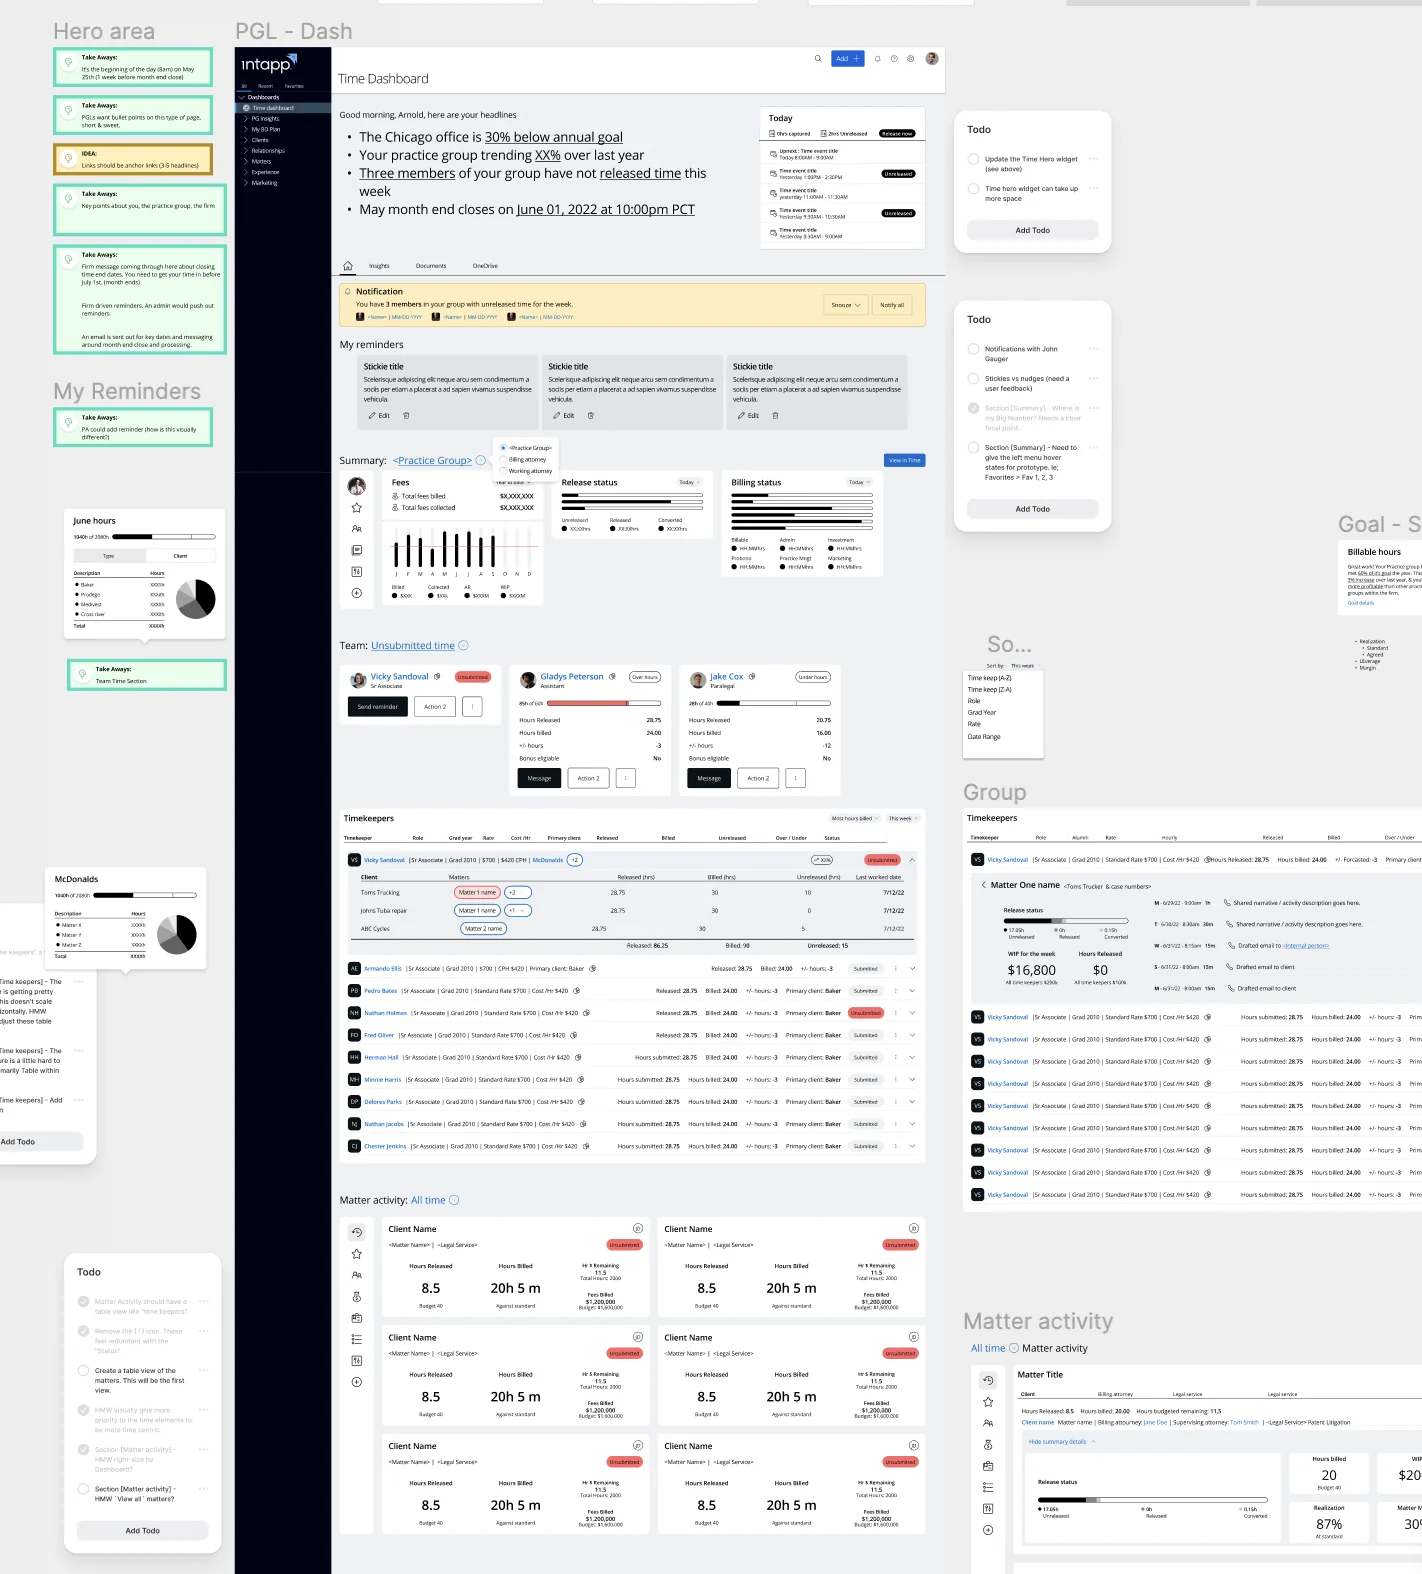
Full size ↗Testing content hierarchyWireframing and shifting data around to test content hierarchy. Three layouts of the same content, which is the point: at this fidelity the only question is what earns the top of the page, and with three personas giving three different answers, that question was the whole project.Full size ↗Third iterationThe third pass, with each region named and justified in the margin — hero area, reminders, goals, group, matter activity. Naming the regions is what turns a layout into an argument you can defend in a review, because every block has to answer why it outranks the one below it.
After
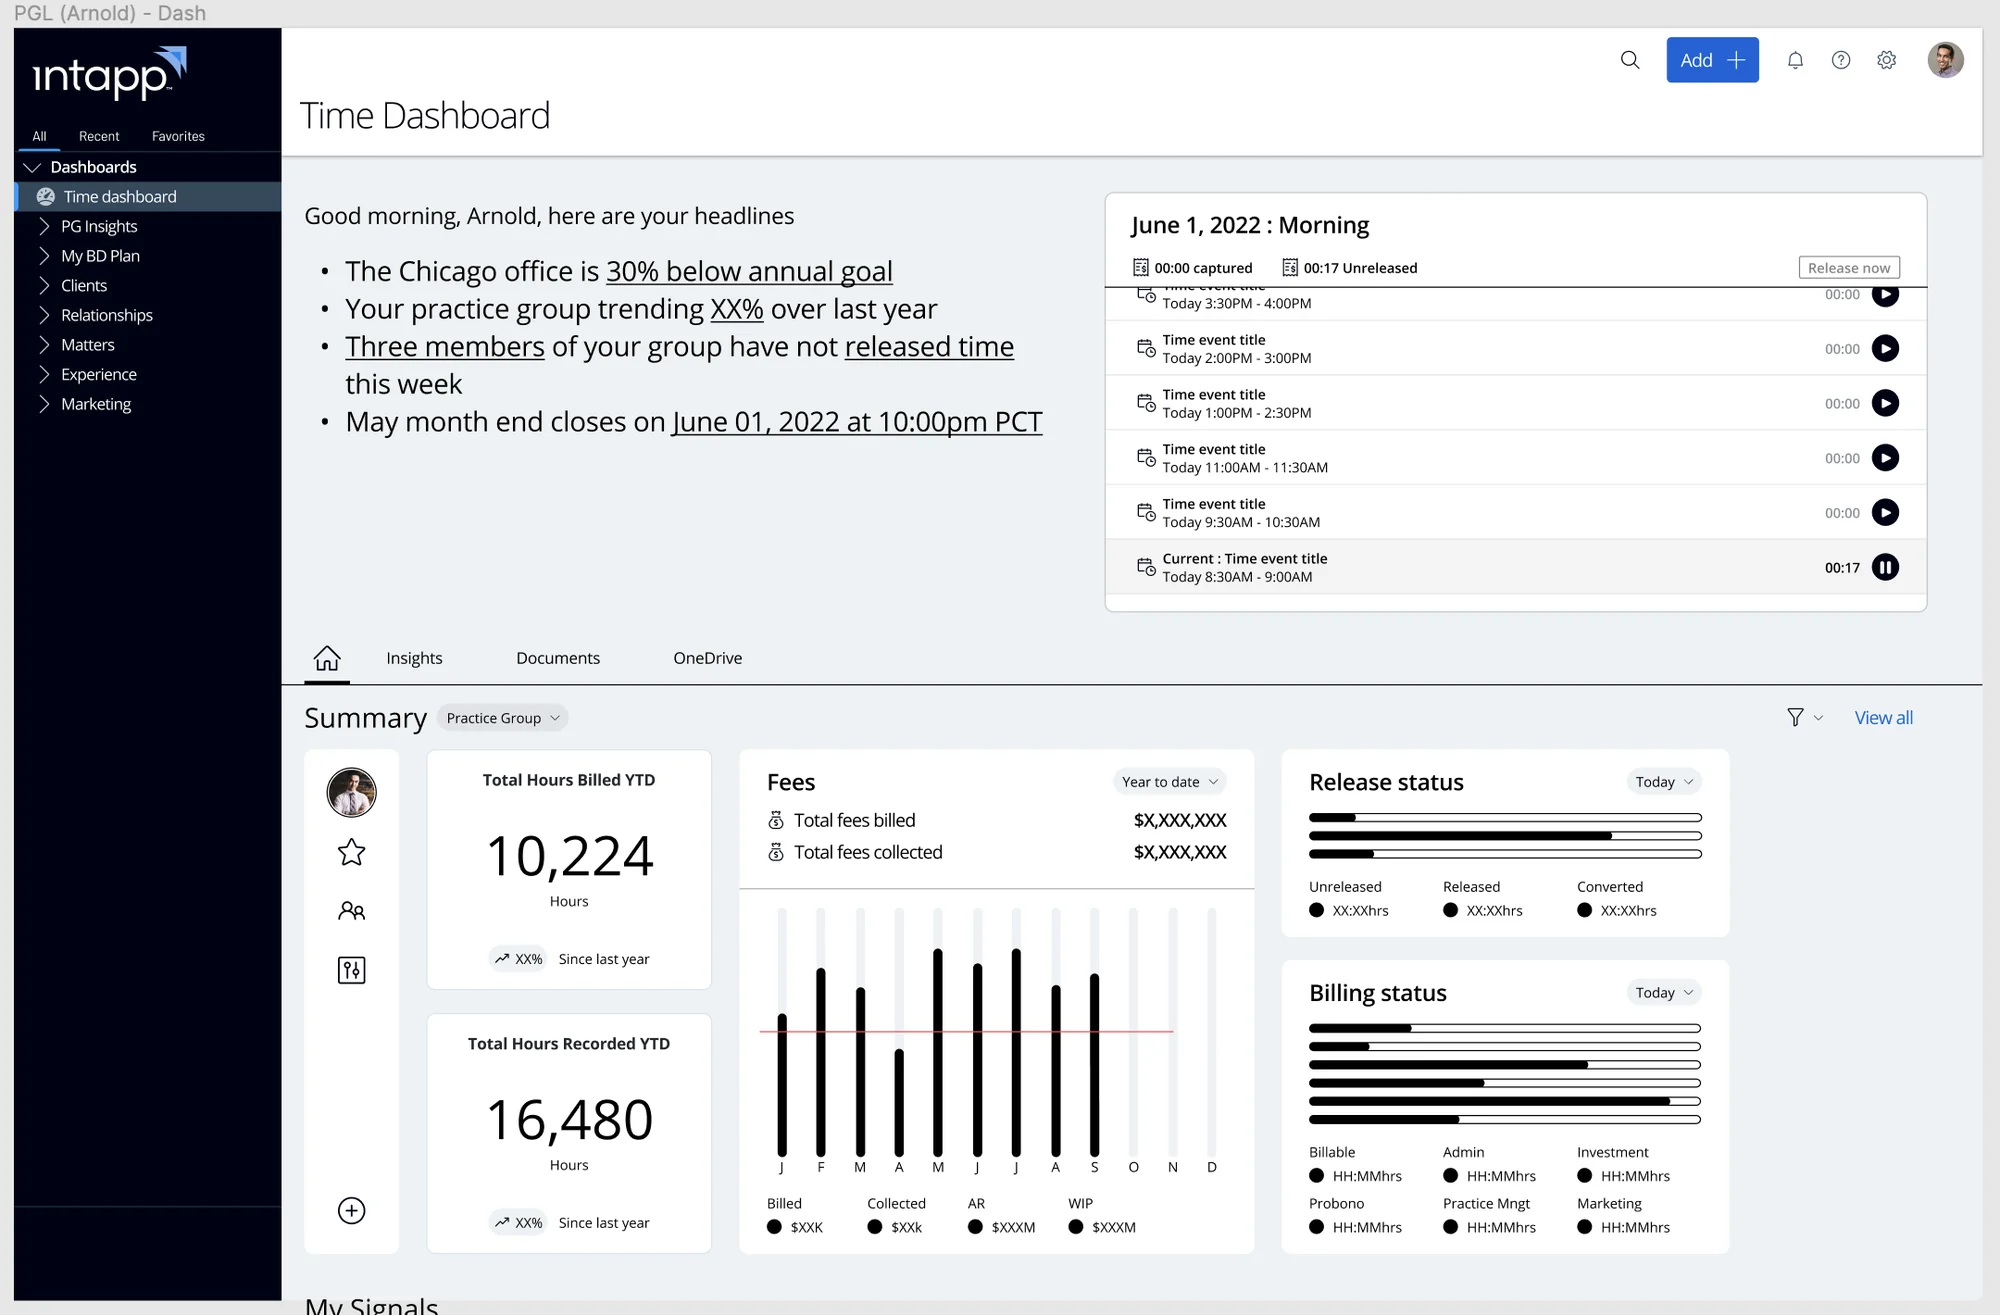
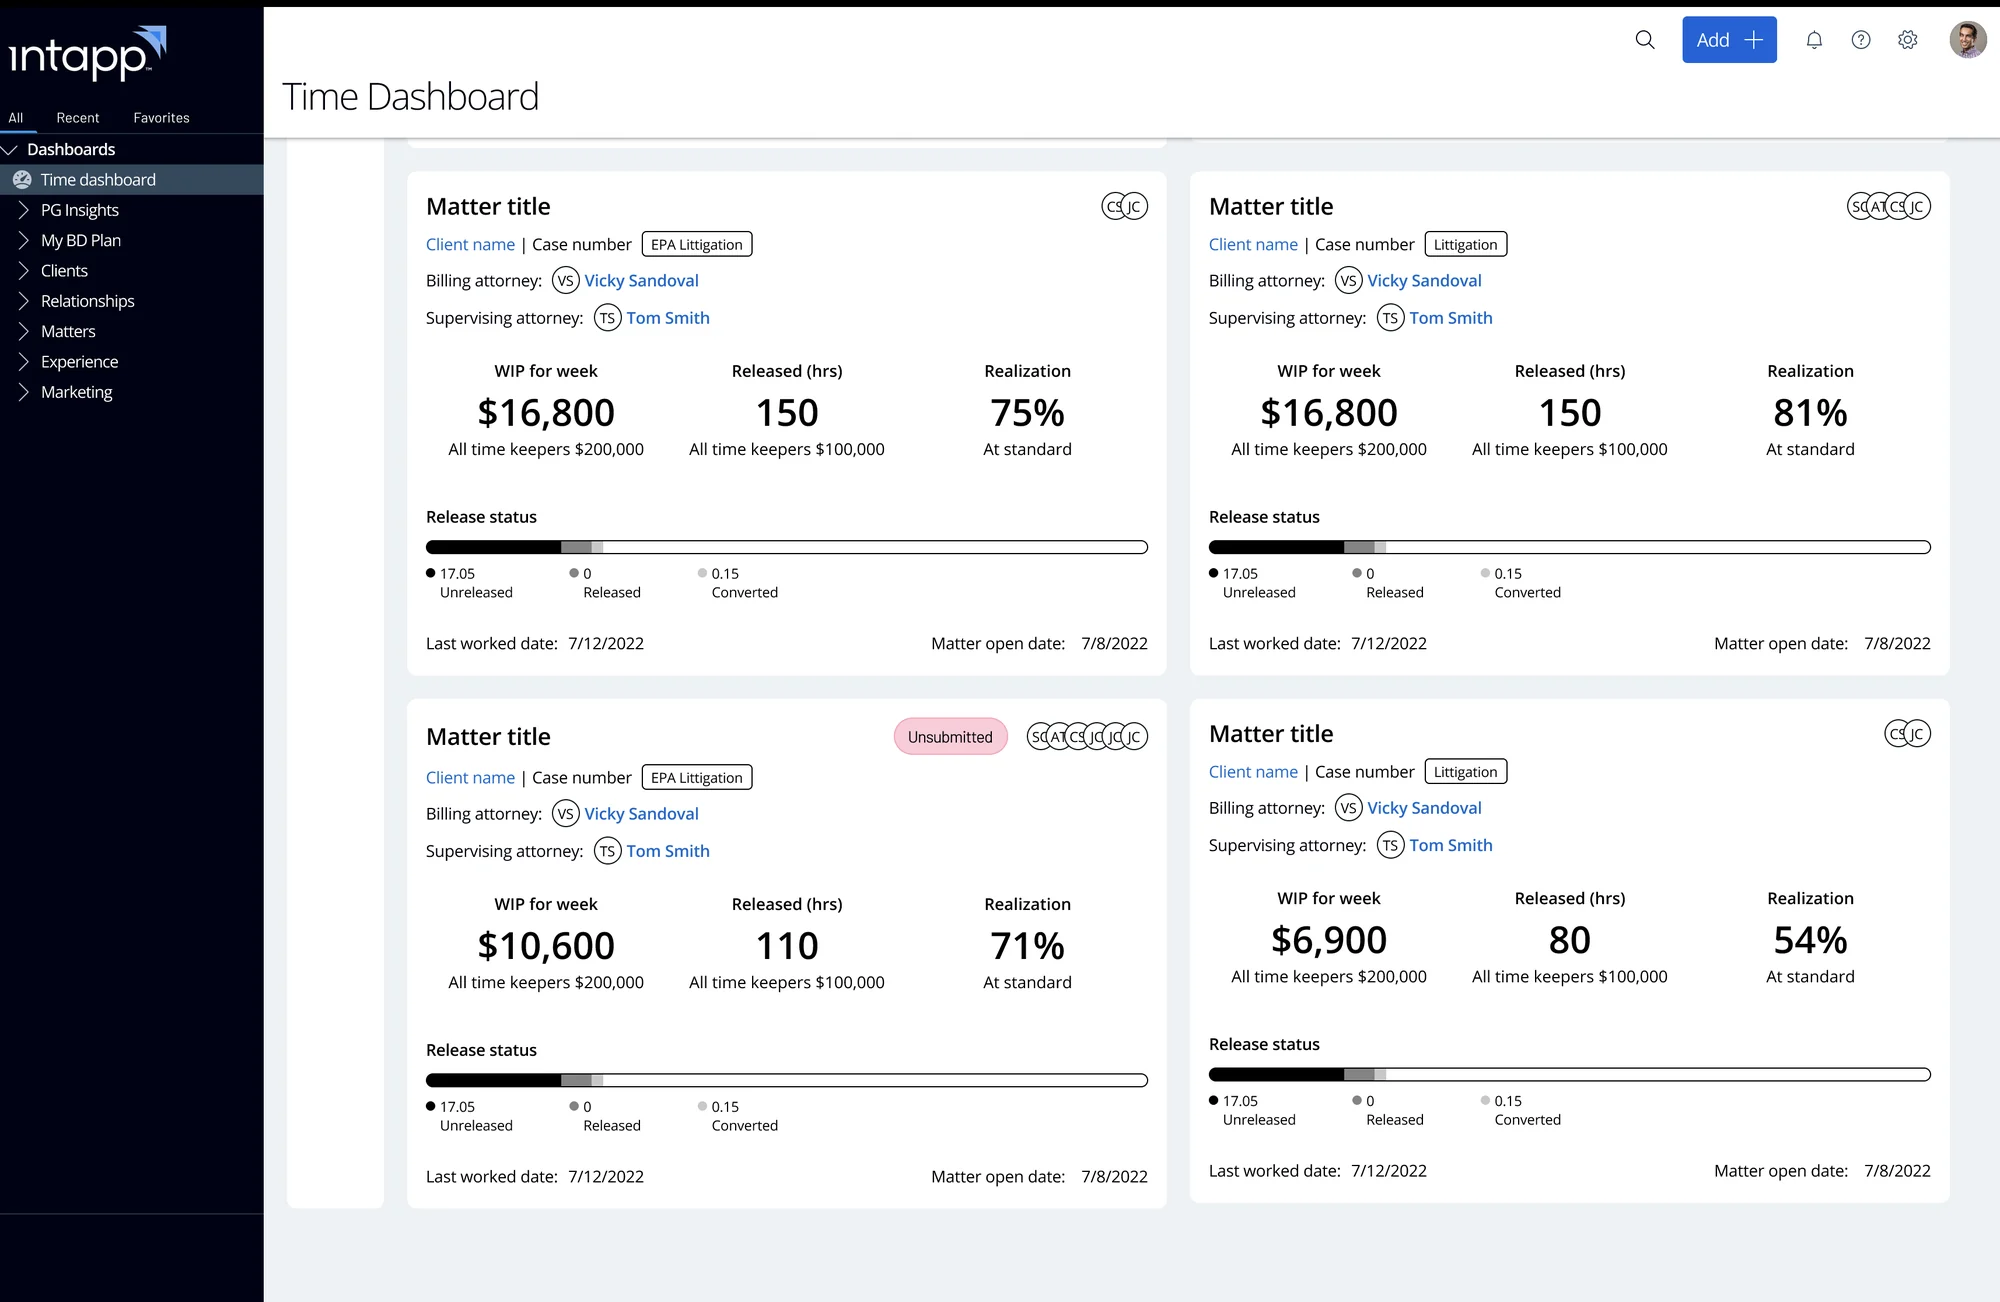
Full size ↗After — the Practice Group Leader dashboard“Good morning, Arnold, here are your headlines.” The Chicago office is 30% below annual goal. Three members of your group have not released time this week. Month end closes on 1 June at 10:00pm. This block answers the persona's own question in plain sentences before a single chart is read — and the captured-time panel beside it turns the legacy product's right-hand column into something you confirm rather than retype.Full size ↗After — matter activityEach matter as a card carrying the three numbers that decide whether it is healthy: work in progress, hours released, and realisation. Realisation — the gap between what you billed and what you collected — is one of the metrics the legacy dashboard was not showing, and finding those gaps was a stated objective rather than a bonus.
What I owned
On the final deliverable I designed the fees section and the navigation bar, and
collaborated with the Senior Designers on their design choices. The work ended in a Figma
prototype.
I was one of several designers on this, and the direction was shared. I would rather tell
you precisely which parts were mine than imply I led a six-month enterprise initiative as an
associate.
What I would tell you in an interview
The transferable part is the nudge pattern. Automatic time capture is a prediction problem with
a trust layer on top: the system guesses what you were doing, and the interface has to make
accepting, correcting, or rejecting that guess cheaper than typing it in yourself. Get the
confirmation cost wrong and people ignore the feed and keep reconstructing Fridays.
That is the same problem shape as every AI feature I have designed since — a system producing
probable answers, and an interface deciding how much work it costs a person to disagree with
one.
The other thing I kept is the headline block. Three personas wanted three different dashboards,
and the resolution was not three dashboards — it was four sentences at the top that say what
changed since you last looked. Most data-dense products would be better if someone wrote that
block first and laid out the charts afterwards.